According to our latest national survey, American leisure travel expectations hit a new high in October.  While travel expectations have been on a positive, stable trajectory for years now, our Fall The State of the American Traveler national tracking survey recorded a strong upward surge in expectations for leisure travel in the upcoming year.  This optimism is shown by a record 37.4 percent of Americans saying they expect to travel more for leisure in the next year, up from 32.2 percent just 3 months earlier. Leisure travel spending expectations are also similarly high, signaling that prospects for continued growth in this segment are strong.

The table below shows the proportion of American leisure travelers who (in the next 12 months) expect to travel more, less and the same as they did in the most recent 12-month period.  The results show strong current traveler optimism.

Travel Optimism Soars
(Percent of all leisure travelers)

Meanwhile, future travel sentiment across the country is slightly uneven, with residents of the coasts showing the highest levels of optimism for travel in the upcoming year.  40.2 percent of residents of the Pacific Coast region expect to travel more in the upcoming year, while 36.7 percent of travelers living in the Northeast and 38.9 percent in the Southeast expect to increase the number of trips they will take in the next year.  Future travel expectations in the central areas of the country are marginally lower.

Travel Optimism: by Region
(Percent of regional residents expecting to travel more in the next 12 months)


Much of this current optimism is being generated by younger travelers.  The charts below show the most recent survey’s data broken out by generation.  As is typically the case, younger travelers show the highest propensities to be planning more travel in the upcoming 12 months.  Nearly two thirds (57.9%) of Millennials currently say they will travel more in the next 12 months.  By comparison, only one quarter of Baby Boomers (26.8%) are planning to bump up the number of trips they will take in the next year.  For Millennials, these are big changes from what was seen this summer.  In our July survey, only 51.4 percent of Millennials said they were planning to take more trips.  The older generations have shown much smaller growth rates between the two most recent survey waves.  It seems clear that growth leisure travel volume in 2017 may depend on the younger generation’s ability to live out these high expectations.

Travel Optimism: by Generation
(Percent of Americans by generation expecting to travel more in the next 12 months)


For more detail, download the latest summary report here.

Destination Analysts’ Takes on the Dallas Leisure Market

Destination Analysts’ founder recently presented one of our company’s most popular speaking topics to a group of hoteliers and DMO professionals at a joint luncheon hosted by the Hospitality Sales and Marketing Association International and the Dallas Fort Worth Area Tourism Council. Several hundred tourism leaders from the Dallas area were presented new data from Destination Analysts’ The State of the American TravelerTM and The State of the International TravelerTM studies, as well as video interviews of travelers discussing their perceptions of Dallas. A summary of key takeaways follows:

The DFW Metroplex is America’s fourth biggest city. Yet, like many destinations, it suffers from a significant awareness and understanding deficit both domestically and abroad. The situation is shown below, using findings taken from our most recent The State of the American TravelerTM survey–a nationally representative survey of 2,000 domestic leisure travelers. When asked in an unaided question to write in the five domestic destinations they most want to visit in the upcoming year, only 2.3 percent wrote in Dallas. The only other area cities receiving votes were Fort Worth (0.2%) and Arlington (0.1%). These disappointing results are, of course, not commensurate with a great city like Dallas.


dallas1


What’s beneath this situation? Despite the outstanding efforts of the metro area’s DMOs and the tourism community overall, the Metroplex obviously faces stiff competition from many compelling and well-funded destinations around the country. Obviously, too, the destination’s message hasn’t penetrated deeply into travelers’ awareness. The chart below shows (for numerous destinations) the relationship between destination appeal, perceived traveler familiarity, and likelihood of visitation. The chart shows visually that the more appealing a destination is, the more likely travelers are to say they are likely to visit it. Further, higher levels of familiarity foster both appeal and likelihood to visit. In this perspective, the Metroplex, while outpacing in-state rivals Austin and Houston, sits in the rear-middle of the pack nationally. This is no place for what is undeniably one of the nation’s most unique and vibrant communities. In our view, this dramatically highlights the need for local communities to continue to support (and very importantly fund) the marketing efforts of area destination marketing organizations.


dallas2


We won’t go into the detailed data in this blog post, but Dallas’ story is the same for international markets. Our The State of the International TravelerTM survey asked 800 likely international travelers in each of 14 major international feeder markets the same set of questions—measuring traveler familiarity, destination appeal and likelihood of visitation. These international results mirror the domestic ones, with Dallas getting relatively low rankings for all three metrics when compared to an array of other U.S. destinations.

The Silver Lining

The DFW Metroplex is a world-class destination, with fantastic attractions, attributes and significant potential. When you’re familiar with the place, it’s hard not to be optimistic about the possibilities. Despite the destination’s challenged current position, our research shows that the area is seen as attractive by a very valuable audience–sophisticated, younger travelers willing to spend money of leisure travel. A segmentation analysis shows that when we compare travelers who say they find Dallas to be an “Appealing” leisure destination to other travelers (i.e., those who do not find the city to be an appealing leisure travel destination) an interesting profile emerges:

American Leisure Travelers who Find Dallas Appealing are:
(Compared to those who don’t find Dallas Appealing)

Demographically different. They are:
More ethnically diverse (69.9% vs. 80.6% Caucasian)
More likely to be Millennials (37% vs. 21.0%)

Frequent Travelers. They:
Took more leisure trips taken in past 12 months (4.8 vs. 4.2 trips)
Are more likely to be international travelers (37% vs. 21% have traveled overseas in the past 12 months)
Have higher travel optimism (44% vs. 31% expect to travel more this year than last)
Are 68% more likely to expect to visit a metropolitan destination this year for leisure reasons

Consume Far More Travel Content When Travel Planning
(% that used each resource to plan a leisure trip in past 12 months)
User-generated content (69% vs. 55%)
Social media (68% vs. 42%)
Online Travel Agencies (40% vs. 27%)
Information gathered from a mobile phone (69% vs. 42%)
A DMO website (50% % vs. 30%)

Bigger Travel Spenders. They have:
Similar incomes, yet…
“Personal financial reasons” constrained their travels less this year (36% vs. 40%)
Expect to spend more this year on leisure travel (44% vs. 31%)
Have 30% larger annual travel budgets ($4,100 on average)

The State of the American TravelerTM – April Update

————————————

Oops! If you’ve arrived here via our email, please forgive the glitch in our copy.  If you’re interested in romance and the American traveler, click here.  If not, please just read on to see how American travel optimism is at an all-time high!

————————————-

If you’ve been paying attention, you’ll know that the U.S. economy has been throwing off some seriously mixed signals during the early part of this year. The bull market turns into a bear, then reverses itself. First quarter GDP growth weakens, but now seems likely to be revised upward; with many economists now seeing the second half of the year as one of strong growth. Long troublesome exchange rates flip, possibly even hitting an inflection point where the dollar may become a boost to exports. Meanwhile, recent data shows the domestic service sector expanded in April as new orders and employment both jumped.

Whatever happens during the rest of the year, we know that ours is a consumer driven economy. Consumers account for more than 70 percent of spending, and in the moment are surprisingly bullish about their future leisure travel. Our April The State of the American TravelerTM survey shows travelers cheerful mood is clearly ongoing. Our survey tracks traveler intent to travel and spend in the upcoming year. Both measures reached historic levels this month. The chart below show this enthusiasm, as more travelers are planning to take a greater number of trips in the upcoming year.

Travel Optimism Grows to Record Levels
(% of American Leisure Travelers Expecting to Take More Trips in the next 12 Months)1

Not only are American travelers planning to travel more, they’re ready to spend.  As the chart below shows, spending expectations are also sky high.  More than one third (35.5%) of travelers expect to spend more in the upcoming year than they did in the last one–yet another record.

Travel Spending Expectations Up
(% of American Leisure Travelers Expecting to Spend More on Leisure Travel in the next 12 Months)

2

As we move into the peak of summer travel season, this optimism bodes very well for the travel industry.  Mixed economic signals or not, American travelers seem primed for an excellent season of exploring our many great destinations.

Marijuana’s place in the tourism industry

America is blazing today. Cannabis aficionados across the continent are gathering to celebrate 4/20, the unofficial, counter-culture holiday enjoyed annually by millions. So many revelers observe this holiday, in fact, that here in our beloved hometown of San Francisco a capacity crowd of over 15,000 is expected to converge on Hippy Hill in Golden Gate Park to partake, and enjoy our beautiful Spring weather.

Much has been said in recent years about marijuana legalization and its impact on tourism. Most of this talk has been simply the personal opinions of those who (for either political or monetary reasons) have an agenda and interest in the conversation’s outcome. As devoted seekers of the unvarnished truth, our tolerance here at Destination Analysts for opinion unsupported by data is low. So, we’ve done a little exploration, and in the free-wheeling spirit of the day, we thought it would be fun to look at some pot stats we’ve collected from our The State of the American TravelerTM survey.

As it turns out, not a huge proportion of tourists actually visit marijuana dispensaries while traveling. Only 3.4 percent of all American leisure travelers have visited a marijuana dispensary while traveling for in the past year, making this niche a relatively small one. Given the size of our traveling population, this means about 6.3 million persons participated in pot-related activities while traveling last year. This small market makes sense, of course, as few states have actually taken the steps to legalize. As of today, only Colorado, Washington, Oregon, Alaska and the District of Columbia have taken the step, leaving most of the country out of the game.

The Current Legalization Map

pot2

For the destination marketer, the million dollar question is, of course, how legalization effects the flow of visitor volume and spending. The picture here is actually quite murky, with more people finding the practice of a destination legalizing pot as unappealing than appealing. In a recent wave of The State of the American TravelerTM , we asked leisure travelers to think about destinations where marijuana is legal (i.e., where they could buy marijuana-related products in a dispensary.) Respondents were then asked how appealing they generally find this practice to be when evaluating such destinations for travel. Nearly 38 percent of leisure travelers fell into the unappealing camp, saying the practice was either “Unappealing” or ” Very unappealing.” About one quarter of American travelers (24.7%) say the practice is either “Appealing” or “Very appealing.” Strong sentiments at both ends of the appeal spectrum point to the negative–as travelers are nearly twice as likely to find legalization to be “Very unappealing” than “Very appealing.”

How Legalization Impacts Destination Appeal
(Legalization makes a destination…) 

pot3

Chart source: The State of the American Traveler, Destination Analysts, Inc.

How pot legalization will play out in terms of the overall economic impact in a given destination obviously can’t be divined from a national survey like this. However, it’s clear that marijuana tourism has appeal in certain segments, as well as the potential to turn other visitors off. Given the unfortunately controversial nature of this topic, we’ll be surprised if a comprehensive and credible study emerges examining the economic impact of these laws on specific destinations.

We’ll remain hopeful, though, and leave you with a few fun marijuana tourism facts to inhale:

  • Marijuana tourism is clearly more popular with the young. Our survey shows that 6.3 percent of Millennial travelers visited a marijuana dispensary while on a leisure trip in the past year. They were three times as likely as Baby Boomers (2.1%) to do so. Among travelers rating legalization as “Appealing” or “Very appealing” fully 46.0 percent were Millennials. Only 15.8 percent of those who find the practice on some level “unappealing” are from this younger generation.
  • In fact, pot tourism appeals to a different overall demographic. Comparing travelers who find marijuana legalization to be an appealing destination attribute to those who don’t, those in the appealing camp tend to be more diverse (ethnically), more likely to be single, less likely to have completed college and have somewhat lower annual household incomes.
  • The naysayers also have bigger travel budgets, and report they expect to spend 17 percent more on leisure travel in the upcoming year than those who find legalization makes a place more appealing.
  • Yet people who approve of pot travel more. Those finding legal marijuana appealing took an average of 4.6 leisure trips in the past year. Travelers who find the practice unappealing took only 4.1 trips.

If you’ve worked with us, you know that the Destination Analysts team is passionately devoted to helping destination marketers understand the modern traveler. For nearly a decade, every six months we’ve produced our flagship domestic study, The State of the American Traveler TM , and have provided it on a complimentary basis to our industry. This research is been widely used and helps our team shape our thinking around the ever-emerging industry topics of the day. With this rapid pace of change in the industry, our sense now is that conducting this study every six months is no longer enough. There are just too many questions floating around and too few answers available to continue on in this format. So, we’re changing course. We’ll still be partnering with our friends at Miles, but will now be conducting the survey every quarter, greatly expanding its potential.

With this good news looking forward, we present to you the first of our quarterly studies, the Destinations Edition. If you’d like to review the summary report, you can download it here. Of course, if you have questions or need extra detail, just call us. Additionally, we also gave a webinar earlier this week in which our President & CEO digs deeper into the edition’s findings. We think you’ll enjoy it.

The State of the American TravelerTM Webinar, March 10th, 2016

Webinar Screenshot

If you have questions you would like to have us explore in the next edition, send them to us!

If you’re reading our blog on this beautiful Saint Valentine’s Day, we think you should stop immediately (like 5 seconds ago), step away from your iPhone and go snuggle up with your love connection.  Seriously, do it.  Our musings on romance and travel can wait.  If you’re reading this sometime after the great lover’s holiday, please enjoy these few fun stats for the destination marketer about finding new love and the modern traveler.

2


Just for the heck of it, we asked a few questions about romance and travel on our soon to be released The State of the American Traveler Survey.  The results paint an unexpected picture of Americans hitting the road in search of love.

As it turns out, if you’re an American looking for a new romance on a vacation, we have some discouraging news for you.  Your chance of success isn’t all that good.  While we may all have secret dreams of “things happening in Vegas that stay in Vegas,” finding a new partner on the road seems to be a little harder than expected.  Our survey shows that last year a little over twenty percent of us have left on a vacation in hopes of making a new romantic connection.   But, alas, only about one quarter of these impassioned travelers (26.3%) found success in meeting a special someone.

Traveler Hook-ups
(Travel Activities in the Past 12 Months)

Romantic vacation


To be blunt, in most of life this success rate would be considered abysmal.  If a high school student scores 26 percent on a Calculus test, they fail.  Remedial Algebra here we come.  In Major League Baseball, a player batting .263 is sent down to the minors, or dumped completely.  On Tinder, whose ego would not be bruised if they knew they got only one out of four right swipes?

We don’t mean to take the wind out of your romantic sails, as there is good news in our research.  We all know travel is a powerful aphrodisiac, and despite the fact that three out of four traveling romance seekers strike out, serendipity isn’t dead.  Coincidental romance  still happens, as overall, 13.7 percent of us met a new romantic partner while on the road last year. This means that over 10 percent of those with no expectations at all for travel romance got lucky (with a new person) on the road last year.  From a purely numerical standpoint, with hundreds of millions of travelers exploring our great country, we declare this to be very Happy Valentine’s Day news.

As an aside, it should come as no surprise that romance and travel is still, for the most part, the domain of the young.  Millennial Generation travelers are nearly three times as likely to meet a new partner on the road as are Baby Boomers.

Where do we go for romance?

Overall, the top destinations we think are romantic are not tremendously surprising.  We asked American travelers in an open-ended question (meaning they could write in any answer they wanted) what single American destination was the most romantic. The list of top destinations that emerged is sprinkled with fabulous cities and traditional honeymoon spots. The top twelve destinations are shown below.

Most romantic destinations


Who wouldn’t get lost in the romantic possibilities of any of these fantastic places?  Wherever we go looking for love, though, hope does spring eternal; and travel romance can be a new start as well as a cure for a bad relationship.  Amazingly, nearly one fifth of American travelers (17.2%) took a leisure trip “specifically to get away from someone” last year.  While some may find this unsettling, to the hopeful romantics here at Destination Analysts, this only confirms the old folk wisdom that you don’t need magic to disappear, just a destination.

The staff here at Destination Analysts has had a lot of fun these last few weeks watching our beloved town prepare for its part in hosting a very successful Super Bowl 50.   But alas, all good things must end.  The party has wrapped.  Workers are taking down the last remnants of Super Bowl City and the last straggling, high-rolling visitors have taken off from SFO.

The circus isn’t all over yet, though, as the media and several of our grandstanding local politicians now seem hell bent on branding the event as a financial failure.  Television news stories are pleased to hand the microphone to any business owner who perceives the event did not fill his or her pockets.  Businesses benefiting from the hundreds of millions in visitor spending are nowhere to be seen.   A small cadre of chotchkie vendors who sell their art on the public streets near at the Ferry building were displaced by Super Bowl City.   A movement to spend half a million bucks making them whole is now the cause célèbre of San Francisco’s fringy political elite.

SUPER-BOWL


This local silliness will hopefully end, but when we saw the national media start piling on, it seemed time for a response.  Take a minute and read this interesting take on the Super Bowl’s economic impact from Mother Jones.

Read Article Here

This is a disappointing piece of journalism.  Yes, the economic impact numbers around this type event are often overstated, but the Super Bowl was without any doubt a huge net benefit to our city’s governmental coffers.  Given the numbers floating around in the media, it seems likely that whatever San Francisco city government spends (the part not reimbursed by the NFL) will be returned at least 4-5 fold when all taxes generated by the event are tallied.

The article is full of factual errors.  The February occupancy rate in San Francisco does not hover around 90 percent–try 77% for the last three years. The displacement effect these “experts” talk about is way overstated. This line of thinking would only make sense to someone who thinks one-dimensionally and knows little about traveler behavior.  Of course there will be some displacement, but ask yourself this. If you wanted to visit San Francisco, would you be likely to completely cancel your trip because room rates were high on a particular five day period in February?  No, you would most likely visit during a different week.  Additionally, many of San Francisco’s hotel guests (especially in the off-season and during mid week) are business travelers.  If they need to come meet with clients or do sales calls in the city, will they simply cancel the trip due to the Super Bowl?   No, of course they won’t.  They will simply work around the issue and come do their business before or after the event.  This is common sense.  Demand for a destination does not express itself the way the naysayers suggest.  The Super Bowl will strongly and positively impact hotel occupancy (and rates) far out on both sides of the event.

The number of hotel rooms filled is, of course, only half of the story.  Room rates soared during the week and the 14 percent hotel tax goes straight back to the city, as do taxes and fees related to all the other spending that went on in town.  When these taxes are submitted, San Francisco will have millions of new incremental dollars waiting to support vital city services.  These would not be there without the game, and are far in excess of what we paid out as hosts.

In a rational conversation, we’d call that a good investment.

Please keep in mind, I’m not saying the city negotiated well with the NFL.  Maybe the terms of the deal could have been better.  That’s an entirely different issue.  However, arguing that the Super Bowl didn’t benefit the city financially (and in a big way) is ridiculous.

As with anything, treating big data as a magic bullet can lead to wounds

This piece was inspired by a recent feature on NPR’s Science Friday that I consider a must-listen to for anyone who relies on or otherwise uses big data in their business processes: http://bit.ly/1Ymx6ap (the title is a perfect summation: “Why Machines Discriminant and How to Fix Them”).  As more big data services compete for voice in decision-making and the band-wagon types rally around the newest with the easiest supplied “answers,” perspective is desperately in order. As anyone that actually has substantial experience working with data knows, data is messy. As such (and pointedly illustrated in the Science Friday piece), it is critical to apply the same analytical and intellectual rigor to our interpretation of big data that we do with survey and all other data. If we don’t, we risk making major decisions on data that may not be entirely appropriate to the questions being asked. 


big-data

—————————-

Exhibit A: Credit Card Conundrum

Tourism research is awash in exciting, new big data solutions, many of them fantastic and many to-be-seen. All share a promise to answer pressing destination marketing organization (DMO) questions. DMOs frequently reach out to us for advice on these products:  Is the value worth the financial commitment?  How can my DMO use the information, given my staffing resources?  How reliable and overall meaningful is data aggregated from one set of sources about my visitors? What truthful insights can truly be drawn?

Big data can be extraordinarily valuable.  In fact, in its proper place it is invaluable.  Where would we be without Google Analytics to help understand our website users’ behaviors?  How relevant would our community building efforts be without Facebook’s audience insights?  Online retailers have irrefutably proven that their big data sets can be harnessed to improve practically every aspect of their online targeting and sales.  The march toward integrating big data into our decision making is powered by countless success stories.

It is important to note, however, that these success stories are very typically internal solutions, using corporate customer data to solve the problems of that same corporation.  What they aren’t is a re-purposing of internal data to solve problems external to the company.  The most successful solutions are not simply an attempt to monetize an internal data set to solve problems unrelated to the corporation collecting the data.

To understand, we need to step back into the world of survey research for a moment.  While the rules of survey methods and statistics might seem arcane and unapproachable to some, they need not be. The essence of a good survey is surprisingly simple.  What makes or breaks a survey depends on two things.  How good is your questionnaire?  And, how well does the sample collected represents the population you’re trying to study? Everything depends on these two things, and a good researcher will go to any length to ensure his/her sample is “representative.”

In short, survey data needs to look like the population studied.  We call this a representative sample; one that accurately reflects the members of the group you seek to understand.  Basically a sample should be an unbiased indication of what the overall population looks like.   For example, if half of your visitors are day-trippers and half are hotel guests, a representative sample might include 200 day visitors and 200 hotel guests.  When a sample is not representative, we get results with what researchers call sampling error, which is bad. Sometimes it’s really bad and leads to bad decision-making.  Going back to the visitor example, if we have a sample of 100 day trippers and 300 hotel guests, whatever conclusions we might draw from this sample will not translate to the entire population of visitors studied.

We urgently need to apply this same line of thinking to the monetized big data sets we use.

We need to be asking and thinking about whether a big data set (no matter how massive) really reflects the larger population of visitors examined.  The thoughtful analyst will carefully consider whether he/she can make generalizations about the destination’s visitor populations from the big data set of just one company, even if the company has a large market share.  As example:

  • Can we use data from one credit card company to make generalizations about the entire population of visitors to a destination?
  • Are subscribers to one mobile carrier significantly different from other carriers? If so, does using the data set from a single mobile carrier’s subscribers create an unbalanced look at visitors and their behaviors/activities in-market?
  • How about online travel agencies (OTAs)? Are people who use these services the same as travelers who book directly?  If not, can we really make generalizations about our visitor population based solely on data from people who book through OTAs?

The answers to these questions are, of course, shrouded in mystery, as proprietary data sets are often impenetrable and/or not comparable to other big data sets.  We can, however, look to other sources for clues as to whether or not a specific big data stream might be representative of the typical population of travelers.

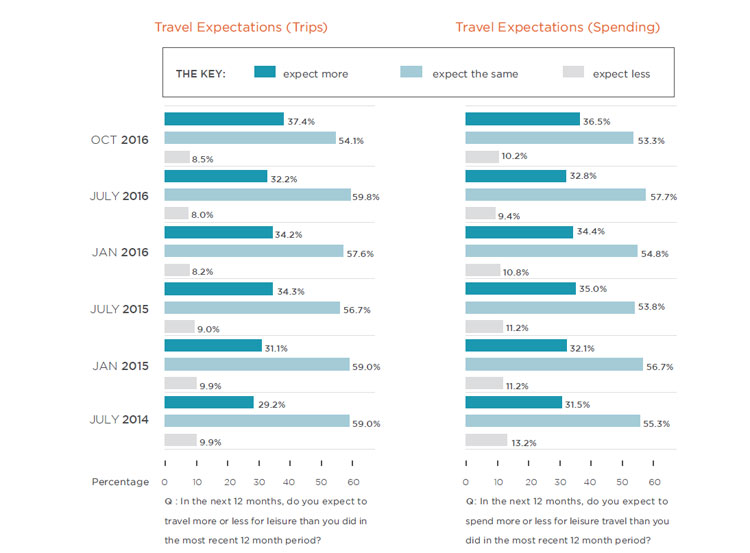
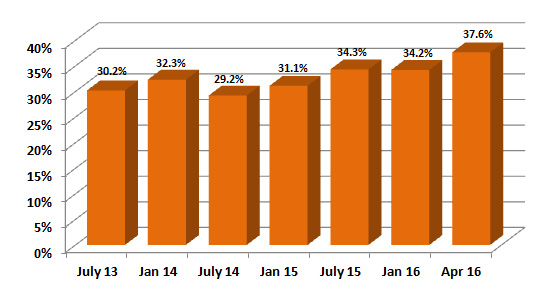
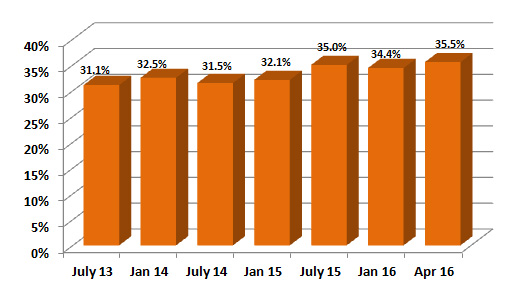
With this in mind, we recently added several questions to our (now quarterly) The State of the American TravelerTM  survey to look for answers for our industry peers.  This study collects travel opinion from a nationally-representative sample of 2,000 American leisure travelers every three months. Let’s take a look at American leisure travelers who say they will be likely to use one of two major credit card brands while traveling for leisure in the next 12 months.  For each card, we compare the travelers likely to use it while traveling to those who are not likely to use that card for trip purchases.  The results show an immediate and striking picture.  Leisure travelers who say they are likely to use either of these cards while traveling differ in significant ways from their non-card using traveling counterparts.

The table below shows a several pertinent examples.  We are not naming the card brands, but they are ones we all know.


bigtdata table

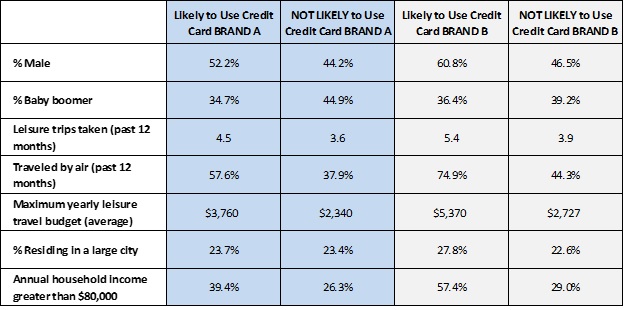
SOURCE: The State of the American TravelerTM, Destination Analysts, Inc.


The picture is clear.  We see that travelers likely to use either major brand are very different from other travelers:

  • Compared to other leisure travelers, those who are likely to use credit card “BRAND A” are less likely to be baby boomers, take more leisure trips annually than other travelers and are more likely to travel by air for leisure. Further, they are more affluent and have significantly higher annual travel budgets.  That is, they are bigger travel spenders.
  • Likely credit card “BRAND B” users differ even more strikingly from non-users. Those who say they are likely to use “BRAND B” are far more likely to be male and also take far more leisure trips (especially by air).  They are more affluent and their annual travel budgets are far, far larger than those travelers who do not use this card.


Application: Where the Rubber Meets the Road

In fairness, these groups do have some similarities.  Their opinions on many travel-related subjects line up neatly.  In the DMO world, however, where the rubber tends to meet the road is in visitor spending and, based on this data, we have reason to suspect that these groups of travelers may spend quite differently.  That needs to keep that in mind when using data about these credit card holders and applying it to a generalization about a destination’s visitor population.

This is but a cautionary tale.  DMOs should think very carefully about how they plan to use big data sets before accepting them as appropriate for their needs. A simple first consideration is how truly representative of visitors the data is.  If this thoughtfulness is not applied, it risks poor decision-making and inaccurate reporting, and the consequent deleterious effect that can have on communities.  None of us want that.


outlook-image


The U.S. travel industry will continue to grow in 2016, fueled by a strong domestic travel market.   While regional performance will vary and the strong dollar and economic challenges abroad will test our ability in the short-term to grow international markets, overall the picture looks positive. In the absence of unexpected shocks, our model suggests that we will see the number of leisure trips taken by Americans to grow by 2.1 percent in 2016.  Overall leisure travel spending will climb 4.0 percent in the coming year.

—————–

The American tourism industry deserves a gold medal for its performance in the post recession world, consistently growing and generating taxes and jobs in an environment fraught with uncertainty.  We expect a winning performance to continue in 2016, driven in part by strong demand for the nation’s varied and compelling leisure travel products. In what follows, we have sketched our thoughts and expectations for leisure travel performance in the coming year.


THE UPSIDES

Strong Traveler Optimism

American optimism about their future leisure travel reached record levels last summer, and consumer confidence has continued to push further forward.  As 2015 drew to a close, the University of Michigan’s consumer sentiment index rose to 92.6. That’s just below the year’s average of 92.9, the highest annual average in 11 years. Consumers’ moods have been boosted by steady job growth and lower gas prices which have improved their overall buying power.

An Expanding Economy

U.S. economic growth continues to be positive, if unimpressive by historical standards.  In 2016, we expect the global economy to follow a slow growth path but, barring unforeseen circumstances, America’s GDP will grow by at least 2.8 percent. This growth means more income in travelers’ pockets and more jobs.  Recent moves by the Federal Reserve reveal its confidence in our economy’s near-term prospects, as well.

Job Growth Continues

The labor market continues to improve, with the most recent national unemployment rate trending consistently downward to a seven-year low of 5.0 percent.   Many analysts expect that, if these trends continue, the domestic economy will reach a full employment level some time the next year.  There are also indications that businesses are offering higher pay to attract and keep workers.  Wages and salary growth showed signs of strength at the end of last year.

Travel Costs Flat

Gas prices grab most of the headlines, with national averages below $2.00 per gallon.  But airfares are also expected to see only moderate growth this year. Unfortunately, the bonus travelers will feel from lower transportation costs will likely be absorbed by increased hotel room rates.  Even with the additions provided by sharing economy services, continued elevated demand for rooms in a marketplace with relatively little increased hotel inventory will push lodging costs up this year.


THE DOWNSIDES

International Woes

America’s travel industry has been buoyed in recent years by big spending international visitors. Change is in the wind though, driven by weak foreign economic performances abroad and a very strong dollar.  As recently as December, the US dollar index (which measures the greenback against top currencies) was up 10 per cent for the year, after gaining nearly 13 per cent in 2014. Foreign exchange impacts can often take time to be realized, and we already seen drops in foreign travel spending.  At best, we expect this segment to remain stable in the upcoming year.

Safety Concerns

The biggest source of uncertainty is, of course, the potential for terrorism and a resulting decline in travel demand.  American traveler concerns about safety while traveling has been relatively stable in recent years.  Over the past several years, only about 1 in 10 Americans reported cutting back on the number of leisure trips taken due to safety concerns.  However, recent terror attacks in Paris and San Bernardino cast a shadow. Since its tragedy, Paris has seen sharp declines in demand and a wave of painful cancellations.  At present, our domestic industry has not been so touched, but the destructive potential must once again be on our radar.


THE BOTTOM-LINE

If you are amongst our fellow travel industry professionals, get ready to enjoy another positive year.  Despite the real and potential challenges we face, the good times much of the travel industry has been experiencing should continue to roll in 2016, buoyed by increased domestic leisure travel volume and spending and strong consumer confidence and optimism.