It’s been said that marketing is a contest for people’s attention.  If that’s the case, at least for this one short moment, a small village in Switzerland may have won the game.  An article just out from The Independent tells the story of the small mountain town of Bergün/Bravuogn that has taken the extraordinary step of outlawing the taking pictures in its bucolic environs.  The rationale behind the new law goes something like this.  The town claims that it is “scientifically proven” that beautiful travel pictures on social media make those seeing them unhappy.  Therefore, allowing travelers to share the extraordinary beauty of their destination with friends back home is unkind, will make people sad.  So, the law was needed to promote general happiness.
 
It’s brilliant and all in good fun.  A bit of good-spirited (and quite effective) publicity grabbing.
 
But here’s the rub.  According to the story, the local DMO says it “has removed photos of the village from its Facebook and Twitter accounts, and has declared its intention to remove them from the Bergün website too.”  We don’t believe they’re serious, for as a long-term strategy this would be disastrous. We’ve studied DMO marketing campaigns for decades and from every point of view possible, and can say definitely and with no hesitation, that in terms of what motivates destination choice, photography is paramount.  Humans are highly visual creatures, and nothing excites interest in a place like beautiful, authentic imagery.  We hope Bergün enjoys the fruits of this smart PR work, but would gently suggest that they don’t ride this wave too long.
 
Why?  Word-of-mouth via social media has become extremely important to travelers.  Social channels are one of the most important places from which leisure travelers draw destination inspiration.  If you don’t believe us, check out page six in our latest The State of the American TravelerTM study.  You’ll see that word-of-mouth (via social media) is one of the more widely relied upon methods for getting inspiration for travel destinations.  If Bergün is really smart, they’ll use their clever new positioning as a way to get visitors to actually post their beauty shots of the town to social channels.
 
In a social climate where the words like “troll” and “hater” have quickly become ubiquitous parts of the American vernacular, it might be easy to believe the myth that people don’t want to see their friends and relatives’ travel pictures—that, in some way, this does make other people unhappy.  Don’t believe it.  Negative voices are often the loudest, but our research strongly shows that most people enjoy seeing and hearing about their friends and relatives’ trip adventures on social media.  Not only do they use social media for trip inspiration, they enjoy it.  The next time anyone tells you that people don’t want to see travel posts on social media, just refer them to the chart below.
 
Enjpoyment of others' travel posts


Innovation is our favorite thing here at Destination Analysts.  We’ve been on the cutting edge of destination research for two decades now, and still love nothing more than moving the needle forward.  Our latest innovation is combining the Voice of the Consumer (i.e., website user survey responses) with website analytics data.  The results are impressive and extremely valuable.  Imagine being able to see what different user types (leisure travelers, meeting planners, the press, etc.) are actually doing on your website.  Or even better, being able to develop your content strategies based on the actual behaviors of travelers at different points in the travel planning funnel.  Do potential visitors who have already decided to visit differ from those simply considering your destination?  If they do (and yeah, they do) your marketing effectiveness will depend on understanding these differences.

Our recent webinar explores this new approach to DMO website research.  We invite to take a little time today and watch.  Just click the image below.

If you’re interested in harnessing this technique to take your online marketing to a new level, contact us today.

Did you know that, on average, 3.4 percent of DMO website users are converted by these sites from an undecided potential traveler to an actual visitor? Our recent landmark study of 13 Western U.S. DMO websites revealed that while this conversion factor may seem modest, the resulting economic impact to the DMOs’ communities is very significant. In fact, for every real, new website user of the 13 DMO websites we studied, $37 in new visitor spending was injected into their localities. Read on to learn more!

While the modern DMO must tackle a dizzying array of online marketing objectives, inspiring undecided website users to visit the destination is quite possibly their most important online objective. The reason for this is straightforward. Generating so-called “incremental visits” is the single greatest source of return on investment created by these organizations’ digital expenditures. In partnership with the DMA West Education & Research Foundation, our team recently completed a fascinating comprehensive study of DMO websites, which benchmarks and explains the reach and impact of these websites.

An executive summary of this exciting research approach pioneered by Destination Analysts is now available. This year-long project analyzed visitor traffic to the websites of 13 DMOs in the Western United States. A primary objective of this project was to estimate the direct visitor spending these websites produce for their respective communities. Essentially, we sought to estimate the total amount of direct visitor spending in-market that was generated by and attributable to the DMO website. Alternatively, it’s the amount of visitor spending in the destination that would not have occurred in the absence of the website.

The results are compelling. There is no doubt that DMO websites are invaluable marketing assets and significant generators of economic impact for their communities. Following are the key economic impact metrics that emerged from the study. These findings are based on 8,845,291 real, new website users of all 13 participating DMO websites between January 1, 2016 and January 1, 2017.

  •  Incremental trips generated by the thirteen participating DMO websites: For 8,845,291 real, new users of the 13 DMO websites during the year, an estimated 304,425 incremental trips were generated for the respective destinations. An incremental trip is one in which the user decided to visit the destination based on their experience with the DMO website, and thus any visitor spending in the destination on these trips can be counted as part of the website’s economic impact. The average incremental trip lasted approximately three days, with a reported in-market spending of $306 per day. These incremental trips are estimated to have generated $270,486,531 in new visitor spending in these destinations.
  • Additional days on trips extended generated by the 13 participating DMO websites studied: A second way DMO websites can generate economic value is by inspiring visitors to extend their already planned visits. The research conducted shows that for 8,845,291 real, new users of these thirteen sites, 146,690 new visitor days were generated for the respective destinations. This is estimated to have resulted in an additional $54,278,815 in incremental visitor spending in these destinations.
  • Total estimated economic impact: The two components discussed above (spending on incremental trips and additional days in-market) comprise the program’s economic impact as defined in this study. It is estimated that for 8,845,291 real, new users of the thirteen participating DMO websites, $324,765,346 in total economic impact was generated for the respective destinations. Based on these findings, it is estimated that each real, new user to a DMO website ultimately generates $36.72 in visitor spending in the destination the site is marketing. Given the total collective budgets of these thirteen DMOs, these websites brought an average return of approximately four-to-one for their respective destinations.
  • Incremental hotel room nights generated by the 13 participating DMO websites studied: Given the number and length of incremental and extended trips generated by the DMO websites, and the proportion of these visitors reporting that they stayed in a hotel in the destination, it is estimated that for 8,845,291 real, new users of the thirteen websites during the 12-month period of study, 533,182 incremental room nights were generated in the respective destinations’ hotels.

Of course, the results of individual DMO websites varied greatly—showing that there is no substitute for conducting your own research. Still, the overall story is compelling. The DMO’s influence on local economic performance through inspiring travel to their destinations is inarguably significant.

Click here to read the complete executive summary of findings.

In this most unusual of moments, there is a great deal of angst in the destination marketing world about the outlook for international visitation to the United States. Travel bans and outrageous rhetoric suggesting the possibility of “extreme vetting” for tourists from markets like Germany and France have analysts predicting that foreign demand for American travel product will fall sharply this year.  While this situation is an extraordinarily serious problem, signs from domestic travelers point in the other direction. Our recently finished Spring edition of The State of the American Traveler™ shows that, at least on the home front, the outlook for leisure travel is surprisingly positive. In fact, Americans are planning more trips and more spending in the upcoming year than ever before, pointing to a strong performance in the remainder of 2017.

According to our April The State of the American Traveler™ tracking survey, more Americans than ever are expecting to increase the number of leisure trips they will take in the upcoming year. Leisure travel optimism is at a record high, mirroring positive trends seen in more general consumer confidence indices. This enthusiastic outlook is illustrated by a record 39.7 percent of Americans saying they expect to travel more for leisure in the next year, up from 37.9 percent in January. Leisure travel spending expectations are also high, with 39.3 percent of American travelers expecting to increase their leisure travel spending in 2017.

The chart below shows this strong optimism, illustrating the share of American leisure travelers who (in the next 12 months) expect to travel more, less and the same as they did in the most recent 12-month period.

Travel Optimism on a Roll
(Percent of all leisure travelers)
 

Meanwhile, future travel sentiment across the country remains somewhat uneven, with residents of the West coast showing the highest levels of optimism for travel in the upcoming year.  42.4 percent of residents of the Pacific Coast region expect to travel more in the upcoming year, while 39.9 percent of travelers living in the Northeast and 40.9 percent in the Southeast expect to increase the number of trips they will take in the next year.

 Regional Expectations
(Percent of leisure travelers)


So, there we have it. Despite the fact that international visitation to the U.S. is predicted to decline, American leisure travelers are ready to go; planning to take more trips and spend more on travel compared to previous years.  One force pushing upward, and one downward. The specific impacts of these countervailing effects on individual destinations will, of course, vary. Whatever the ultimate outcome, it looks like we’re in for a very interesting year.


Early to bed and early to rise makes a man healthy, wealthy and wise.

— Benjamin Franklin

Ben Franklin understood something we modern folks have forgotten.  Getting ample rest and relaxation is vital to a happy and productive life.  Not only are we a chronically sleep deprived nation, with 40 percent of us getting less than the recommended amount of nightly slumber, our use of vacation time has plummeted in recent years.  The U.S. Travel Association reports that (on average) Americans take only 16 days of vacation a year, one full week less than in 1980.  The list of problems and health risks associated with our “always-on” lifestyle is well-known and includes an array of detrimental effects including heart disease, depression, cognitive impairment, diabetes, anxiety disorders, obesity and even the potential for a dreaded loss of enthusiasm for bedroom fun!

At Destination Analysts, we don’t need research to tell us that this is simply no way to live.  And, possibly in response to this crisis, many Americans now seem to share our concern and are taking their vacation advice from Poor Richard’s Almanac.  Many of us are now building vacation experiences specifically around health and wellness.  In a recent The State of the American TravelerTM survey, we explored Americans’ interests in travel specifically to nurture personal health and wellness.  The results are intriguing, and suggest that destination marketers would be well-advised to keep their eyes on this market and be ready to take advantage when possible.  Consider the chart below.

Health & Wellness Trips Taken (Past 12 Months, American Leisure Travelers)

Question: How many of these leisure trips were focused primarily on trip activities to promote your personal health and wellness? Base: Percent of American Leisure Travelers.

Nearly one quarter of American leisure travelers have taken a “health and wellness” trip in the past year.  However, one such annual trip is simply not enough for many of these travelers.  The average health and wellness traveler took 2.96 such trips in the past year, with one in twenty who took four or more such trips last year.  That’s a lot of trips and likely a lot of money spent.  Health and wellness travel is clearly a very significant and possibly under-serviced niche market.

Interestingly, it seems as if those travelers most in need of health and wellness trips may be the least likely to actually take them, and vice versa.  The graphs below show that Millennial leisure travelers are most likely to have taken at least one health and wellness trip in the past year.  Undoubtedly a result of their relative youth, they are also the least likely generation to report that personal health concerns had kept them from traveling in the past year.  In short, they are twice as likely as Baby Boomers to take health and wellness trips, and half as likely to say they reduced their travels this last year over health concerns.


Health & Wellness Trips Taken (Past 12 Months, by Generation)
Reduced # of Leisure Trips Taken for Health Reasons (Past 12 Months, by Generation)
Question: How many of these leisure trips were focused primarily on trip activities to promote your personal health and wellness? Base: Percent of Leisure Travelers.
Question: In the PAST 12 MONTHS, which (if any) of the following kept you from traveling more for leisure than you would have otherwise preferred?  Base: Percent of Leisure Travelers.

Gen X actually looks like it may be a sweet spot for health and wellness travel.  Fully a quarter of American Gen X travelers have taken a wellness trip in the past year and these Gen X wellness travelers have taken 3.6 trips such trips in the past year on average (compared to 2.4 such trips amongst Millennial health and wellness travelers).

What does health and wellness travel really entail?  To find out, we asked survey respondents to tell us what health-related activities they would be interested in doing on their leisure trips.    For the most part, American travelers as a whole are most attracted to better known, relaxation-related activities like massages (36.3%), hot springs (35.5%) and spa treatments (32.2%).  Other health and wellness-oriented activities fell further behind amongst the general traveling public, although younger travelers clearly exhibit more diversity in the health and wellness activities they are enthusiastic for.  The diagram below shows the proportion of leisure travelers in each generation who say they’re interested in an array of health-related activities tested.

Interest in Health & Wellness Activities (Percent of travelers, by generation)

Question:  Which of the following would you be interested in doing on your leisure trips? Base: Percent of Leisure Travelers.

Health and wellness travel clearly represents a very large potential market, but one that appears to be more alluring to Millennial and Gen X travelers.  While surely niche markets exist for other healing activities outside the mainstream, the health and wellness activities these travelers will most commonly desire are likely to revolve around more traditional spa-related ways to reduce stress.  With this focus, we hope that destinations that can position themselves as a unique place to relax and rejuvenate will cash in on those seeking relief from the harried, always-on lifestyle of the American traveler.

New York Post Page 1

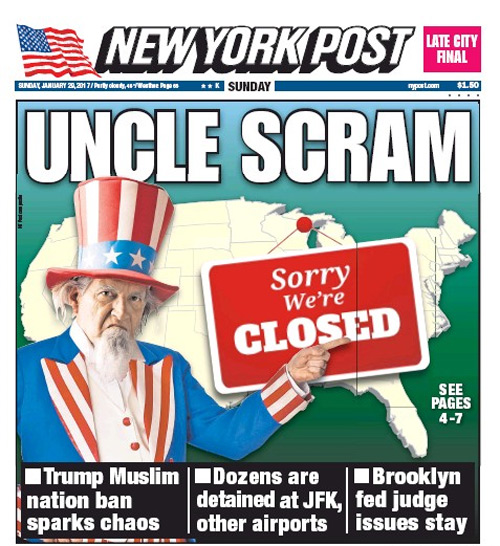
There’s little denying that we’re living in uncertain times. Just days ago, who would have predicted mass protests at U.S. airports or newspaper headlines suggesting America’s tourism industry is closed for business? Our industry, and in fact, the American economy as a whole, depends on robust international travel.  International travelers spent $246.2 billion in the U.S. in 2015, supporting 1.2 million jobs. Putting this in perspective, travel to America supports more jobs than there are people in San Jose, California, the heart of Silicon Valley.  For further comparison, a manufacturing giant like Ford Motor Company employs about 187,000 people in total, with a profit of $6.3 billion. International travel is not mere big business, it’s enormous business, comprising one-third of all U.S. service exports. So it should come as no surprise that travel professionals have been grappling with how the whole of Donald Trump—from his ethos, hospitality experience, and leadership to his many surrounding controversies—will affect the U.S. travel industry.

To look into the matter for our anxious travel industry colleagues, we added a number of questions to our The State of the International TravelerTM survey, our annual study tracking traveler sentiment in 14 of America’s key international feeder markets across the globe.  In early January, we surveyed a representative sample of 800 likely international travelers in each of these 14 countries, for a total of over 11,000 total surveys collected worldwide.  As anticipated, the 2017 study (available now) yielded some very interesting insights into how international travel audiences feel about Mr. Trump.

Overall Sentiment Leans Negative

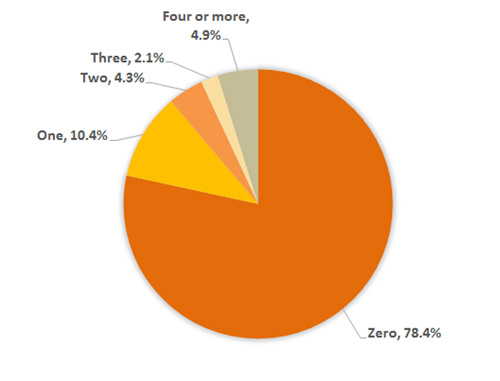
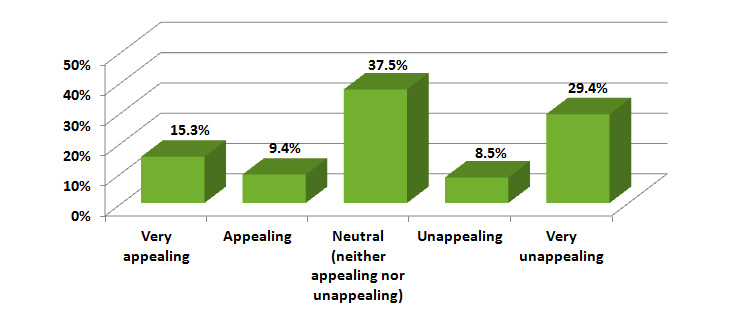
Feelings about America’s new leader can, of course, range from the very positive to the very negative.  Overall, it appears that President Trump is more disliked than liked.  Figure 1 (below) shows that about 43 percent of likely international travelers say his election has worsened, to some degree, their opinion of America. Only 16.3 percent reported that his ascension has improved their overall view of the country.

Figure 1:  Effect of Election on Opinion of America
(Average, All Countries Surveyed)

Question – Did the results of the recent U.S. Presidential election change your overall opinion of the United States of America?  If so, how?  (Please select the answer that best fills in the blank below) As a result of the election, my overall opinion of the United States is _________.

Overall opinion about America

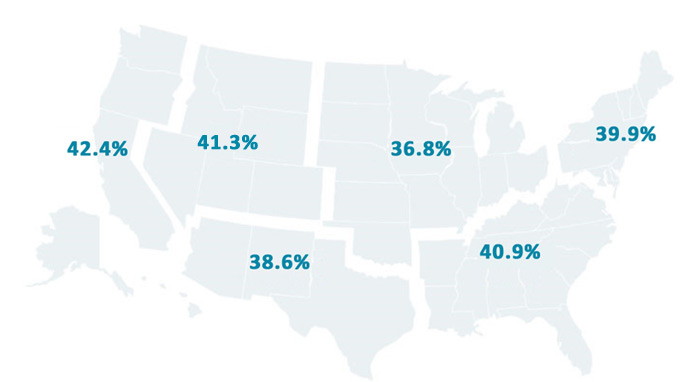
Nevertheless, this sentiment is far from equal across countries. For this same question, Figure 2 (below) illustrates what researchers call the Bottom 2 and Top 2 box scores, or the proportion of survey respondents saying the election has made them feel “Worse” or “Much worse” or “Better” or “Much better” about America.

Figure 2: Effect of Election on Overall Opinion of America
(Detail by Country)

Question – Did the results of the recent U.S. Presidential election change your overall opinion of the United States of America? If so, how? (Please select the answer that best fills in the blank below) As a result of the election, my overall opinion of the United States is _________.

Improved and worsened opinions on America

Countries with a net improvement—where the percent of international travelers’ whose opinions of America improved as a result of the election is greater than the percent whose opinions of America worsened—include Brazil, China and, most notably, India. India’s net opinion changed significantly, with 44.1 percent rating their opinion of America as “Better” or “Much better” post-election. However, as seen in the chart at the right of Figure 2, the majority of countries studied have a declined opinion. Residents of some of our country’s largest international travel markets—i.e. Canada, Mexico and the UK—reported “Worse” and “Much worse” opinions about America as a result of the recent presidential election. This is not good news for our industry, but then the question remains, does the lower overall opinion translate to decreased likelihood to visit America? Figure 3 below offers insight.

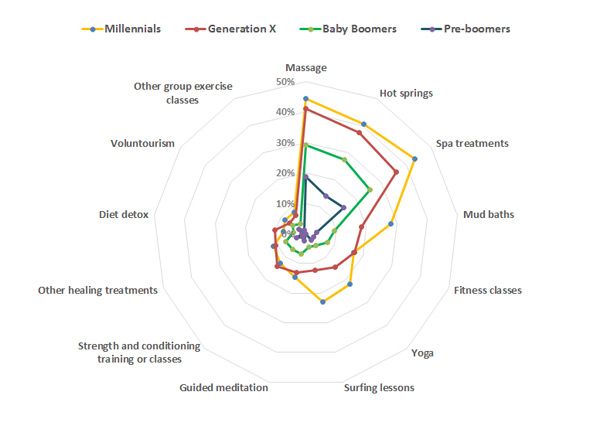
Figure 3: Effect of Likelihood of Visiting America
(Average, All Countries Surveyed)

Question — How have the results of the U.S. Presidential election effected the likelihood you will visit the United States in the NEXT FIVE (5) YEARS? (Select the answer that best fills in the blank below) I am ____________ to visit the United States in the NEXT FIVE (5) YEARS.

Likelihood of visit

The net negative feelings President Trump generates are evident in most countries, but it may not translate into a measurable impact on visitation. In fact, slightly more international travelers are more likely (to some degree) to visit the U.S. than less likely. Still more than half are neutral, indicating the election had no impact on their travel plans. This is of course intuitive; simply disliking a politician doesn’t mean America isn’t an entirely awesome visitor destination. For fun, our researchers interviewed a few tourists here in our hometown of San Francisco. The response of one Chinese tourist sums up the consistent sentiment we heard from these travelers: “It doesn’t matter to me. Many Chinese don’t like Trump, but we want to visit America.”

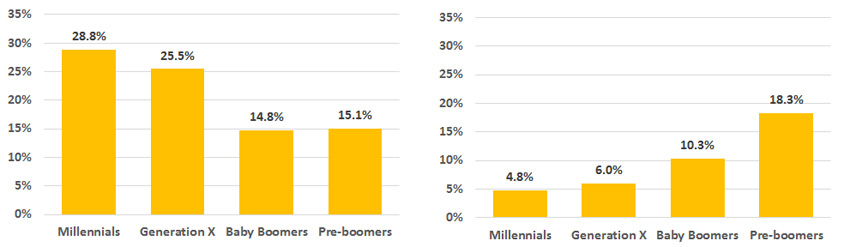
Figure 4: Effect on Likelihood of Visiting America
(Detail by Country)

Question — How have the results of the U.S. Presidential election effected the likelihood you will visit the United States in the NEXT FIVE (5) YEARS? (Select the answer that best fills in the blank below) I am ____________ to visit the United States in the NEXT FIVE (5) YEARS.

More likely and less likely to visit America

Even though the overall impact may be relatively muted, again there are large differences by country. There is a larger net number of international travelers in India, Brazil, and China who indicate that they are more likely to visit because of the election results than less likely. These countries have become prominent international travel players as their economies have developed over the past fifteen years. The combined visitation of India, China and Brazil makes up 7.6 percent of all international travel to the U.S. Thus, as a result of the election, we may potentially experience continued, or even slightly higher, increases in visitation from these markets.

On the other hand, Mexico, Germany, Holland and Canada indicate that they are net less likely to travel to the U.S. because of the election results. The unfortunate reality we face with this finding is that Canada and Mexico are our nation’s greatest sources of international travel volume and spending. Combined, visitation from these two important countries account for half of all international travel to the U.S.

Describing Trump: A Tale of Two Countries

The different national perspectives on President Trump amongst international travelers are striking. To dig a little deeper, we asked international travelers in these 14 countries, “What one word best describes Donald Trump?” With this, we hoped to gain a broader sense of how each country viewed the 45th President of the United States. Comparing two countries reporting the greatest impact by the Trump election, India and Mexico, vividly illuminates the differences in perceptions across markets. The word cloud below summarizes responses written in by Indian travelers.

Figure 5: India’s International Travelers’ Descriptions of Donald Trump

Question – What one word best describes Donald Trump?
 

India Trump word cloud

Amid all the controversial news and executive orders flying around, it may be difficult to easily understand why Indian travelers have such positive feelings about President Trump. In India, it appears that the Trump brand is primarily associated with luxury. The brand is a glitzy, golden, rich business that offers prestige and the appearance of wealth. Trump Towers Mumbai, is expected to open next year with 300 apartments available to purchase. Its apartments are reportedly selling at a 30 percent premium over other apartments in the area. Indians may also see similarities between Trump’s election and their own Prime Minister. Both ran on platforms of being an outsider to the political dynamic and ability to take charge and get things done. Additionally, India is largely untouched by Trump’s well-publicized ire, which seems mostly directed at Mexico, China and the Middle East.

While India, for the most part, views Trump positively, it’s no surprise that our neighbor to the south rates him differently. The word cloud below illustrates Mexican sentiment.

Figure 6: Mexican International Travelers’ Descriptions of President Trump

Question – What one word best describes Donald Trump?
 

Mexico Trump word cloud

President Trump’s relationship with Mexico is well documented and hardly needs repeating—and the word cloud above very clearly and directly describes the nation’s sentiment. One man, two countries, and their opinions of him are like night and day.

The overall impact of President Trump’s actions is yet to be seen. However, as evidenced by the response to President Trump’s recent travel ban, it is likely to be pronounced and uneven across international markets. Destination Analysts’ eye is firmly on this for the industry, and we will share with you what we learn from travelers as this presidency progresses.

According to our latest national survey, American leisure travel expectations hit a new high in October.  While travel expectations have been on a positive, stable trajectory for years now, our Fall The State of the American Traveler national tracking survey recorded a strong upward surge in expectations for leisure travel in the upcoming year.  This optimism is shown by a record 37.4 percent of Americans saying they expect to travel more for leisure in the next year, up from 32.2 percent just 3 months earlier. Leisure travel spending expectations are also similarly high, signaling that prospects for continued growth in this segment are strong.

The table below shows the proportion of American leisure travelers who (in the next 12 months) expect to travel more, less and the same as they did in the most recent 12-month period.  The results show strong current traveler optimism.

Travel Optimism Soars
(Percent of all leisure travelers)

Meanwhile, future travel sentiment across the country is slightly uneven, with residents of the coasts showing the highest levels of optimism for travel in the upcoming year.  40.2 percent of residents of the Pacific Coast region expect to travel more in the upcoming year, while 36.7 percent of travelers living in the Northeast and 38.9 percent in the Southeast expect to increase the number of trips they will take in the next year.  Future travel expectations in the central areas of the country are marginally lower.

Travel Optimism: by Region
(Percent of regional residents expecting to travel more in the next 12 months)


Much of this current optimism is being generated by younger travelers.  The charts below show the most recent survey’s data broken out by generation.  As is typically the case, younger travelers show the highest propensities to be planning more travel in the upcoming 12 months.  Nearly two thirds (57.9%) of Millennials currently say they will travel more in the next 12 months.  By comparison, only one quarter of Baby Boomers (26.8%) are planning to bump up the number of trips they will take in the next year.  For Millennials, these are big changes from what was seen this summer.  In our July survey, only 51.4 percent of Millennials said they were planning to take more trips.  The older generations have shown much smaller growth rates between the two most recent survey waves.  It seems clear that growth leisure travel volume in 2017 may depend on the younger generation’s ability to live out these high expectations.

Travel Optimism: by Generation
(Percent of Americans by generation expecting to travel more in the next 12 months)


For more detail, download the latest summary report here.

Destination Analysts’ Takes on the Dallas Leisure Market

Destination Analysts’ founder recently presented one of our company’s most popular speaking topics to a group of hoteliers and DMO professionals at a joint luncheon hosted by the Hospitality Sales and Marketing Association International and the Dallas Fort Worth Area Tourism Council. Several hundred tourism leaders from the Dallas area were presented new data from Destination Analysts’ The State of the American TravelerTM and The State of the International TravelerTM studies, as well as video interviews of travelers discussing their perceptions of Dallas. A summary of key takeaways follows:

The DFW Metroplex is America’s fourth biggest city. Yet, like many destinations, it suffers from a significant awareness and understanding deficit both domestically and abroad. The situation is shown below, using findings taken from our most recent The State of the American TravelerTM survey–a nationally representative survey of 2,000 domestic leisure travelers. When asked in an unaided question to write in the five domestic destinations they most want to visit in the upcoming year, only 2.3 percent wrote in Dallas. The only other area cities receiving votes were Fort Worth (0.2%) and Arlington (0.1%). These disappointing results are, of course, not commensurate with a great city like Dallas.


dallas1


What’s beneath this situation? Despite the outstanding efforts of the metro area’s DMOs and the tourism community overall, the Metroplex obviously faces stiff competition from many compelling and well-funded destinations around the country. Obviously, too, the destination’s message hasn’t penetrated deeply into travelers’ awareness. The chart below shows (for numerous destinations) the relationship between destination appeal, perceived traveler familiarity, and likelihood of visitation. The chart shows visually that the more appealing a destination is, the more likely travelers are to say they are likely to visit it. Further, higher levels of familiarity foster both appeal and likelihood to visit. In this perspective, the Metroplex, while outpacing in-state rivals Austin and Houston, sits in the rear-middle of the pack nationally. This is no place for what is undeniably one of the nation’s most unique and vibrant communities. In our view, this dramatically highlights the need for local communities to continue to support (and very importantly fund) the marketing efforts of area destination marketing organizations.


dallas2


We won’t go into the detailed data in this blog post, but Dallas’ story is the same for international markets. Our The State of the International TravelerTM survey asked 800 likely international travelers in each of 14 major international feeder markets the same set of questions—measuring traveler familiarity, destination appeal and likelihood of visitation. These international results mirror the domestic ones, with Dallas getting relatively low rankings for all three metrics when compared to an array of other U.S. destinations.

The Silver Lining

The DFW Metroplex is a world-class destination, with fantastic attractions, attributes and significant potential. When you’re familiar with the place, it’s hard not to be optimistic about the possibilities. Despite the destination’s challenged current position, our research shows that the area is seen as attractive by a very valuable audience–sophisticated, younger travelers willing to spend money of leisure travel. A segmentation analysis shows that when we compare travelers who say they find Dallas to be an “Appealing” leisure destination to other travelers (i.e., those who do not find the city to be an appealing leisure travel destination) an interesting profile emerges:

American Leisure Travelers who Find Dallas Appealing are:
(Compared to those who don’t find Dallas Appealing)

Demographically different. They are:
More ethnically diverse (69.9% vs. 80.6% Caucasian)
More likely to be Millennials (37% vs. 21.0%)

Frequent Travelers. They:
Took more leisure trips taken in past 12 months (4.8 vs. 4.2 trips)
Are more likely to be international travelers (37% vs. 21% have traveled overseas in the past 12 months)
Have higher travel optimism (44% vs. 31% expect to travel more this year than last)
Are 68% more likely to expect to visit a metropolitan destination this year for leisure reasons

Consume Far More Travel Content When Travel Planning
(% that used each resource to plan a leisure trip in past 12 months)
User-generated content (69% vs. 55%)
Social media (68% vs. 42%)
Online Travel Agencies (40% vs. 27%)
Information gathered from a mobile phone (69% vs. 42%)
A DMO website (50% % vs. 30%)

Bigger Travel Spenders. They have:
Similar incomes, yet…
“Personal financial reasons” constrained their travels less this year (36% vs. 40%)
Expect to spend more this year on leisure travel (44% vs. 31%)
Have 30% larger annual travel budgets ($4,100 on average)

The State of the American TravelerTM – April Update

————————————

Oops! If you’ve arrived here via our email, please forgive the glitch in our copy.  If you’re interested in romance and the American traveler, click here.  If not, please just read on to see how American travel optimism is at an all-time high!

————————————-

If you’ve been paying attention, you’ll know that the U.S. economy has been throwing off some seriously mixed signals during the early part of this year. The bull market turns into a bear, then reverses itself. First quarter GDP growth weakens, but now seems likely to be revised upward; with many economists now seeing the second half of the year as one of strong growth. Long troublesome exchange rates flip, possibly even hitting an inflection point where the dollar may become a boost to exports. Meanwhile, recent data shows the domestic service sector expanded in April as new orders and employment both jumped.

Whatever happens during the rest of the year, we know that ours is a consumer driven economy. Consumers account for more than 70 percent of spending, and in the moment are surprisingly bullish about their future leisure travel. Our April The State of the American TravelerTM survey shows travelers cheerful mood is clearly ongoing. Our survey tracks traveler intent to travel and spend in the upcoming year. Both measures reached historic levels this month. The chart below show this enthusiasm, as more travelers are planning to take a greater number of trips in the upcoming year.

Travel Optimism Grows to Record Levels
(% of American Leisure Travelers Expecting to Take More Trips in the next 12 Months)1

Not only are American travelers planning to travel more, they’re ready to spend.  As the chart below shows, spending expectations are also sky high.  More than one third (35.5%) of travelers expect to spend more in the upcoming year than they did in the last one–yet another record.

Travel Spending Expectations Up
(% of American Leisure Travelers Expecting to Spend More on Leisure Travel in the next 12 Months)

2

As we move into the peak of summer travel season, this optimism bodes very well for the travel industry.  Mixed economic signals or not, American travelers seem primed for an excellent season of exploring our many great destinations.

Marijuana’s place in the tourism industry

America is blazing today. Cannabis aficionados across the continent are gathering to celebrate 4/20, the unofficial, counter-culture holiday enjoyed annually by millions. So many revelers observe this holiday, in fact, that here in our beloved hometown of San Francisco a capacity crowd of over 15,000 is expected to converge on Hippy Hill in Golden Gate Park to partake, and enjoy our beautiful Spring weather.

Much has been said in recent years about marijuana legalization and its impact on tourism. Most of this talk has been simply the personal opinions of those who (for either political or monetary reasons) have an agenda and interest in the conversation’s outcome. As devoted seekers of the unvarnished truth, our tolerance here at Destination Analysts for opinion unsupported by data is low. So, we’ve done a little exploration, and in the free-wheeling spirit of the day, we thought it would be fun to look at some pot stats we’ve collected from our The State of the American TravelerTM survey.

As it turns out, not a huge proportion of tourists actually visit marijuana dispensaries while traveling. Only 3.4 percent of all American leisure travelers have visited a marijuana dispensary while traveling for in the past year, making this niche a relatively small one. Given the size of our traveling population, this means about 6.3 million persons participated in pot-related activities while traveling last year. This small market makes sense, of course, as few states have actually taken the steps to legalize. As of today, only Colorado, Washington, Oregon, Alaska and the District of Columbia have taken the step, leaving most of the country out of the game.

The Current Legalization Map

pot2

For the destination marketer, the million dollar question is, of course, how legalization effects the flow of visitor volume and spending. The picture here is actually quite murky, with more people finding the practice of a destination legalizing pot as unappealing than appealing. In a recent wave of The State of the American TravelerTM , we asked leisure travelers to think about destinations where marijuana is legal (i.e., where they could buy marijuana-related products in a dispensary.) Respondents were then asked how appealing they generally find this practice to be when evaluating such destinations for travel. Nearly 38 percent of leisure travelers fell into the unappealing camp, saying the practice was either “Unappealing” or ” Very unappealing.” About one quarter of American travelers (24.7%) say the practice is either “Appealing” or “Very appealing.” Strong sentiments at both ends of the appeal spectrum point to the negative–as travelers are nearly twice as likely to find legalization to be “Very unappealing” than “Very appealing.”

How Legalization Impacts Destination Appeal
(Legalization makes a destination…) 

pot3

Chart source: The State of the American Traveler, Destination Analysts, Inc.

How pot legalization will play out in terms of the overall economic impact in a given destination obviously can’t be divined from a national survey like this. However, it’s clear that marijuana tourism has appeal in certain segments, as well as the potential to turn other visitors off. Given the unfortunately controversial nature of this topic, we’ll be surprised if a comprehensive and credible study emerges examining the economic impact of these laws on specific destinations.

We’ll remain hopeful, though, and leave you with a few fun marijuana tourism facts to inhale:

  • Marijuana tourism is clearly more popular with the young. Our survey shows that 6.3 percent of Millennial travelers visited a marijuana dispensary while on a leisure trip in the past year. They were three times as likely as Baby Boomers (2.1%) to do so. Among travelers rating legalization as “Appealing” or “Very appealing” fully 46.0 percent were Millennials. Only 15.8 percent of those who find the practice on some level “unappealing” are from this younger generation.
  • In fact, pot tourism appeals to a different overall demographic. Comparing travelers who find marijuana legalization to be an appealing destination attribute to those who don’t, those in the appealing camp tend to be more diverse (ethnically), more likely to be single, less likely to have completed college and have somewhat lower annual household incomes.
  • The naysayers also have bigger travel budgets, and report they expect to spend 17 percent more on leisure travel in the upcoming year than those who find legalization makes a place more appealing.
  • Yet people who approve of pot travel more. Those finding legal marijuana appealing took an average of 4.6 leisure trips in the past year. Travelers who find the practice unappealing took only 4.1 trips.