During Destination Analysts’ November 2022 webinar update on The State of the American Traveler, we sat down with representatives from Wheelchair Travel, Accessible Travel Solutions, as well as Travel Oregon and Visit Mesa to discuss broadening accessibility to travel experiences and increasing the industry’s ability to be more welcoming to all. You can watch in the video above and read below for our key takeaways from this important discussion.

According to John Morris of Wheelchair Travel, while disabilities vary between people, and everyone has different needs, so it is important for destinations to reach out to their travelers to see how they can meet those needs. This is especially key when considering that seniors overlap significantly with the disabled population, and accessibility comes into play for both groups.

Some of the main barriers in accessible travel in the current landscape include misunderstandings at the decision-maker levels about the accessible travel market and the definition of accessible travel. It is challenging for destination leaders to evaluate the opportunity and understand how best to move forward. The need for expertise is part of this obstacle, and this in turn feeds into resources. Oftentimes, organizations do not have an accessibility expert and there is limited knowledge around what tools exist, according to John Sage of Accessible Travel Solutions.

It is also an awareness issue, says Morris. There is a lack of understanding of the size of the community of travelers with disabilities. The Centers for Disease Control and Prevention (CDC) estimates that 26% of the U.S. population has a disability. According to the U.S. Bureau of Transportation Statistics, 12% of the population with a disability use a wheelchair. But there is a need for awareness around the opportunities that exist in the marketplace. Because of the lack of accessible environments, travelers with disabilities are less likely to be visible in the population of travelers visiting destinations, which exacerbates this issue. But in fact, there is an opportunity for destinations to really make a foray into that market, given the size of the population and the universal desire to travel that is shared by all travelers, regardless of their background.

Our panel shared resources that are available to organizations for support in their efforts to become accessible destinations and businesses. Among these, Travelability is a wonderful resource, according to Visit Mesa; the organization has a summit next summer that is highly recommended. Visit Mesa also recommends using community resources such as Facebook Groups to learn directly from travelers with disabilities about what their pain points are. Travel Oregon suggests turning to city managers, as cities often have Americans with Disabilities Act (ADA) Coordinators who can provide information on accessibility in the community. The local community of people with disabilities can also be a wonderful resource.

We want to take the opportunity to once again thank Wheelchair Travel, Accessible Travel Solutions, Travel Oregon and Visit Mesa for sharing their learnings and best practices with the greater travel industry and for their incredible efforts in expanding travel’s accessibility.


Global Tourism is booming. An estimated 1.3 billion persons traveled internationally in the past year, marking a robust 7 percent annual growth rate. However, it’s painfully clear that America hasn’t kept up. Our country has been losing market share, and with it, billions of dollars in tourism revenues. How much does the controversy swirling around Donald Trump contribute to this situation? Our The State of the International Traveler survey sheds some light on the topic. This year’s findings suggest that while the exchange rates and the cost of visiting the U.S. are the most important factors behind our declining market share, our politics matter too. The actions and policies of President Trump, the most visible symbol of our contentious political climate, have clearly played a role in America’s ongoing tourism challenge.

Five years ago, our company decided to launch a research effort to understand and track what international travelers think about America and its many diverse destinations. This survey, conducted at the start of each year, is called The State of the International Traveler. In it, we probe the minds of more than eleven thousand likely international travelers in America’s fourteen largest feeder markets. This study also gives us the opportunity to learn about current social issues, such as the controversial positions and policies of our 45th President.

America’s Tourism Brand in Decline
(% writing in America as one of the destinations they most want to visit this year)

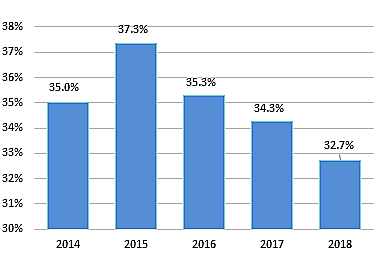
It’s clear that America is facing a challenge. We ask international travelers an unaided question to write in the top three countries they “most want to visit” in the upcoming year. Fortunately, we are still the world’s most popular destination, but our lead is narrowing. Since 2015, the proportion of international travelers reporting that the U.S. is one of their top destination has steadily declined, slipping by 12.4 percent.

Our contentious politics are one part of this problem. Nearly half of all travelers surveyed reported having a worse opinion of the United States based on our political situation, specifically the “actions and policies of President Donald Trump.” When asked how the actions and policies of President Trump has impacted their view of the United States, half (49.8%) said their opinion of our country has worsened to some degree. Offsetting this, about one-in-five (18.1%) said their opinion of us has improved. Shifts in interest in visiting the United States is somewhat less pronounced. About one-third of likely international travelers (35.4%) say they are less interested in visiting due to our President’s actions and policies.

Interestingly, the large overall proportion of travelers reporting they’re less likely to visit (35.4%) masks significant variation between countries. The charts below show that while there are problematic outcomes in much of the world, in India, Brazil and China, the situation is reversed. A larger share of travelers in these countries are “more likely” to visit than “less likely,” indicating President Trump may be a net positive in these markets.

The root cause of the decline in America’s market share is complicated, and politics are only one part of the full picture. The situation bcomes clearer when we look at reasons travelers have decided not to visit the United States. The chart below shows the proportion of all likely international travelers who say each reason keeps them from visiting the U.S. more often.


As expected, the reasons most commonly cited for skipping on a trip to America were financial. The most frequent answer given was that the U.S. is “too expensive,” followed by the closely-related “unfavorable exchange rates.” The strong dollar in recent years has made travel to America costly, and the situation is unlikely to change in the near future. Still, nearly one out of every five (18.2%) likely international travelers say that discomfort with our national politics is keeping them away.

Among the many intractable challenges DMO marketers face, deciding which traveler types to go after is always top-of-mind.  One thing is clear though: our industry’s keen interest in the relatively nascent Chinese travel market is well-founded.  Not only is the volume of potential visitors from China staggering, Chinese visitors intend to do the one thing that is most desired by destinations–spend a lot of money in market.  Our 2018 The State of the International Traveler survey asked likely international travelers to report what they would expect to spend on a two-week vacation in the U.S.  The chart at the bottom of this post shows the average amount that travelers from each country say they would expect to spend overall, for shopping and for hotels.  Three fun facts about Chinese travelers jump out at us.

  • Chinese travelers have, by far, the largest travel budgets. The typical Chinese traveler would budget $6,362 for two weeks in America, or $454 per day, which far surpasses the closest competitor. The second biggest spending country was Australia at $5,355 for a two-week trip, or $383 per day.
  • One Chinese traveler’s economic impact equals three Canadians. The sheer difference in terms of expected budget for an American vacation between China and other countries is extraordinary.  China’s travel budget gap with other countries is most pronounced when we look at America’s largest contributor of international visitors, Canada.
  • Way outside the norm set by other countries, Chinese travelers would also plan to spend more on shopping than on lodging. The typical Chinese traveler would budget $1,888 for shopping and only $1,271 for lodging in hotels.  This won’t be music to the hotel revenue manager’s ears, as that represents a meager $91.78 per day.  Chinese travelers’ budget for shopping is almost as large as the entire trip budget of Canadian visitors.  It is more than double that of most other countries studied.  When it comes to retail spending around a destination, nobody compares.

Average Expected Travel Budgets: Two Week Vacation in America


Source: The State of the International Traveler, 2018, Destination Analysts, Inc. A survey of over 800 likely international leisure travelers in each of 14 of America’s biggest feeder markets.

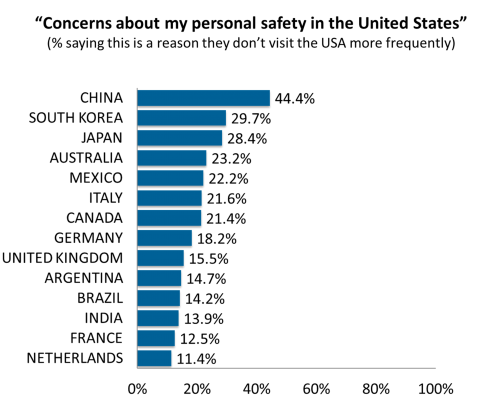
America may be the most high-profile of countries. What happens here can quickly find its way into the news around the world. Of course, no news travels more quickly than bad news, and America has recently had no shortage of such content. Mass shootings, wildfires, landslides, violent protests, hurricanes (and even now a volcanic eruption in Hawaii) have all punctuated the news cycle this year. Does the American proclivity to deliver sensational headlines keep international travelers away? It seems so, at least to a degree. One in five likely international travelers in America’s top feeder markets say personal safety concerns have kept them from visiting more.

The last few years have seen a substantial increase in overall global travel volume alongside a downward trend in unaided interest in visiting the United States. The latter trend has been measured in our annual international tracking study The State of the International Traveler. In 2017, we saw a -2.9% decrease in the overall number of international travelers writing in “The United States” in an open-ended question asking about destinations that they most wanted to visit in the coming year. Our most recent 2018 wave of the study showed an additional -4.7% drop in that figure. This consistent downward trend in unaided interest in visiting the United States strongly suggests that international travelers are choosing other destinations over the United States when they travel.

In this most recent wave of our international tracking study, we added a question to determine major deterrents to visiting the United States. The top two reasons cited for not visiting the U.S. most often were financial in nature, “too expensive” and “unfavorable exchange rate.” Not too surprising with the strength of the US dollar nowadays. But the third most cited deterrent to visiting was “Concerns about my personal safety.”

Personal safety is a serious concern of many travelers. One-in-five (20.8%) travelers around the world say safety concerns have kept them from visiting the U.S.  Interestingly, when we look at the responses by country, we see that the Asian countries of China, South Korea and Japan are the most likely to report personal safety concerns while traveling in the United States.  Nearly half of Chinese travelers reported this concern, a disturbing result.


Safety is also a major consideration when travelers are deciding which specific U.S. destinations to visit. Information about safety was rated overall as the fourth-most important type of information to U.S. destination decisions, following only hotels/lodging, restaurants/food and national parks. Information about safety outranks information about shopping, iconic and historical attractions, entertainment/events and transportation, to name just a few.

Travelers from China, Japan and South Korea were also the most likely to say that online video content would be influential in their travel planning and most importantly in the destination decision. This suggests that there is an opportunity, especially for destinations who are focused on moving the needle on visitation from countries like China, to create more online video content about how safe and welcoming it is here in the United States. Some destinations are already capitalizing on this opportunity. Take the “Everyone is Welcome” video campaign from Discover LA. The Los Angeles Tourism & Convention Board reported a substantial increase in visitation from China last year, setting them apart from the downward trend in visitor interest currently seen by the nation as a whole.  You can read more about it here.

Marketing Insight:  Online video content featuring welcoming, safe communities is a win on two counts: it addresses a top-of-mind travel concern, and delivers the message in a popular, preferred channel.

How Well Do You Know International Travelers?

--This Quiz is hard, but give it your best shot!--

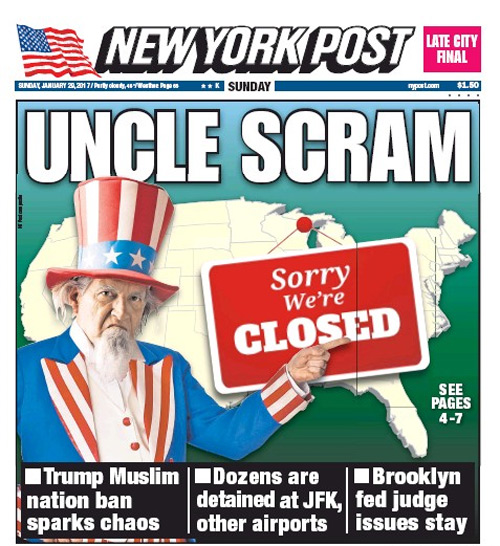
New York Post Page 1

There’s little denying that we’re living in uncertain times. Just days ago, who would have predicted mass protests at U.S. airports or newspaper headlines suggesting America’s tourism industry is closed for business? Our industry, and in fact, the American economy as a whole, depends on robust international travel.  International travelers spent $246.2 billion in the U.S. in 2015, supporting 1.2 million jobs. Putting this in perspective, travel to America supports more jobs than there are people in San Jose, California, the heart of Silicon Valley.  For further comparison, a manufacturing giant like Ford Motor Company employs about 187,000 people in total, with a profit of $6.3 billion. International travel is not mere big business, it’s enormous business, comprising one-third of all U.S. service exports. So it should come as no surprise that travel professionals have been grappling with how the whole of Donald Trump—from his ethos, hospitality experience, and leadership to his many surrounding controversies—will affect the U.S. travel industry.

To look into the matter for our anxious travel industry colleagues, we added a number of questions to our The State of the International TravelerTM survey, our annual study tracking traveler sentiment in 14 of America’s key international feeder markets across the globe.  In early January, we surveyed a representative sample of 800 likely international travelers in each of these 14 countries, for a total of over 11,000 total surveys collected worldwide.  As anticipated, the 2017 study (available now) yielded some very interesting insights into how international travel audiences feel about Mr. Trump.

Overall Sentiment Leans Negative

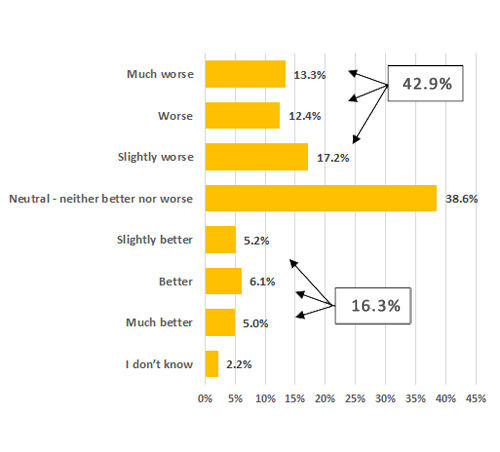
Feelings about America’s new leader can, of course, range from the very positive to the very negative.  Overall, it appears that President Trump is more disliked than liked.  Figure 1 (below) shows that about 43 percent of likely international travelers say his election has worsened, to some degree, their opinion of America. Only 16.3 percent reported that his ascension has improved their overall view of the country.

Figure 1:  Effect of Election on Opinion of America
(Average, All Countries Surveyed)

Question – Did the results of the recent U.S. Presidential election change your overall opinion of the United States of America?  If so, how?  (Please select the answer that best fills in the blank below) As a result of the election, my overall opinion of the United States is _________.
Overall opinion about America

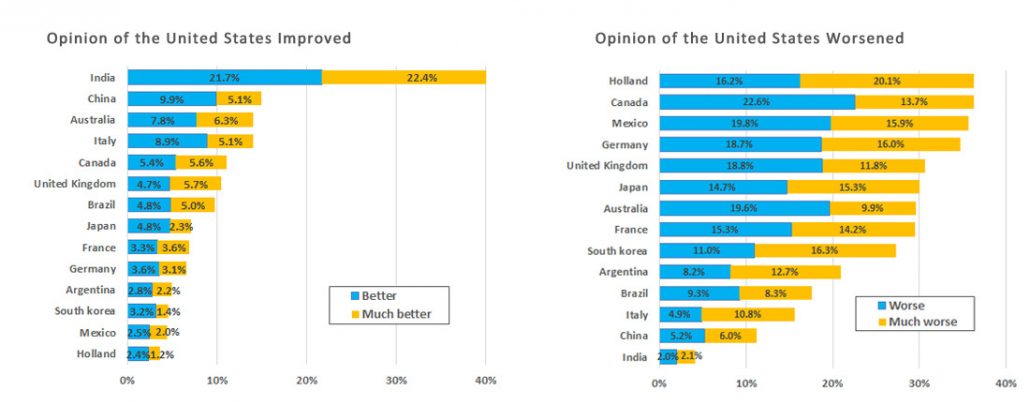
Nevertheless, this sentiment is far from equal across countries. For this same question, Figure 2 (below) illustrates what researchers call the Bottom 2 and Top 2 box scores, or the proportion of survey respondents saying the election has made them feel “Worse” or “Much worse” or “Better” or “Much better” about America.

Figure 2: Effect of Election on Overall Opinion of America
(Detail by Country)

Question – Did the results of the recent U.S. Presidential election change your overall opinion of the United States of America? If so, how? (Please select the answer that best fills in the blank below) As a result of the election, my overall opinion of the United States is _________.
Improved and worsened opinions on America

Countries with a net improvement—where the percent of international travelers’ whose opinions of America improved as a result of the election is greater than the percent whose opinions of America worsened—include Brazil, China and, most notably, India. India’s net opinion changed significantly, with 44.1 percent rating their opinion of America as “Better” or “Much better” post-election. However, as seen in the chart at the right of Figure 2, the majority of countries studied have a declined opinion. Residents of some of our country’s largest international travel markets—i.e. Canada, Mexico and the UK—reported “Worse” and “Much worse” opinions about America as a result of the recent presidential election. This is not good news for our industry, but then the question remains, does the lower overall opinion translate to decreased likelihood to visit America? Figure 3 below offers insight.

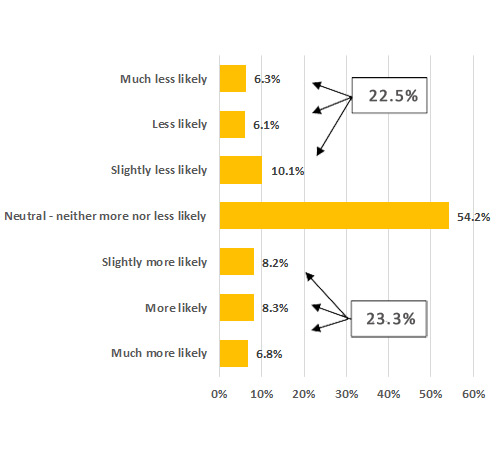
Figure 3: Effect of Likelihood of Visiting America
(Average, All Countries Surveyed)

Question — How have the results of the U.S. Presidential election effected the likelihood you will visit the United States in the NEXT FIVE (5) YEARS? (Select the answer that best fills in the blank below) I am ____________ to visit the United States in the NEXT FIVE (5) YEARS.
Likelihood of visit

The net negative feelings President Trump generates are evident in most countries, but it may not translate into a measurable impact on visitation. In fact, slightly more international travelers are more likely (to some degree) to visit the U.S. than less likely. Still more than half are neutral, indicating the election had no impact on their travel plans. This is of course intuitive; simply disliking a politician doesn’t mean America isn’t an entirely awesome visitor destination. For fun, our researchers interviewed a few tourists here in our hometown of San Francisco. The response of one Chinese tourist sums up the consistent sentiment we heard from these travelers: “It doesn’t matter to me. Many Chinese don’t like Trump, but we want to visit America.”

Figure 4: Effect on Likelihood of Visiting America
(Detail by Country)

Question — How have the results of the U.S. Presidential election effected the likelihood you will visit the United States in the NEXT FIVE (5) YEARS? (Select the answer that best fills in the blank below) I am ____________ to visit the United States in the NEXT FIVE (5) YEARS.
More likely and less likely to visit America

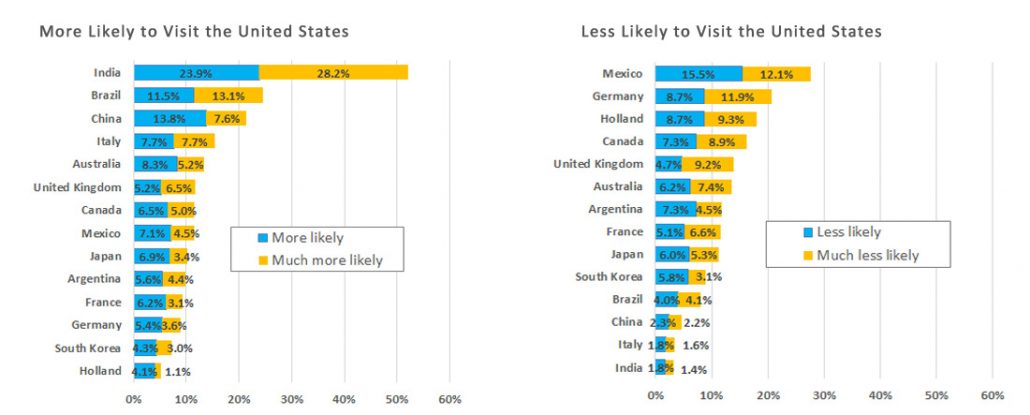
Even though the overall impact may be relatively muted, again there are large differences by country. There is a larger net number of international travelers in India, Brazil, and China who indicate that they are more likely to visit because of the election results than less likely. These countries have become prominent international travel players as their economies have developed over the past fifteen years. The combined visitation of India, China and Brazil makes up 7.6 percent of all international travel to the U.S. Thus, as a result of the election, we may potentially experience continued, or even slightly higher, increases in visitation from these markets.

On the other hand, Mexico, Germany, Holland and Canada indicate that they are net less likely to travel to the U.S. because of the election results. The unfortunate reality we face with this finding is that Canada and Mexico are our nation’s greatest sources of international travel volume and spending. Combined, visitation from these two important countries account for half of all international travel to the U.S.

Describing Trump: A Tale of Two Countries

The different national perspectives on President Trump amongst international travelers are striking. To dig a little deeper, we asked international travelers in these 14 countries, “What one word best describes Donald Trump?” With this, we hoped to gain a broader sense of how each country viewed the 45th President of the United States. Comparing two countries reporting the greatest impact by the Trump election, India and Mexico, vividly illuminates the differences in perceptions across markets. The word cloud below summarizes responses written in by Indian travelers.

Figure 5: India’s International Travelers’ Descriptions of Donald Trump

Question – What one word best describes Donald Trump?
 

India Trump word cloud

Amid all the controversial news and executive orders flying around, it may be difficult to easily understand why Indian travelers have such positive feelings about President Trump. In India, it appears that the Trump brand is primarily associated with luxury. The brand is a glitzy, golden, rich business that offers prestige and the appearance of wealth. Trump Towers Mumbai, is expected to open next year with 300 apartments available to purchase. Its apartments are reportedly selling at a 30 percent premium over other apartments in the area. Indians may also see similarities between Trump’s election and their own Prime Minister. Both ran on platforms of being an outsider to the political dynamic and ability to take charge and get things done. Additionally, India is largely untouched by Trump’s well-publicized ire, which seems mostly directed at Mexico, China and the Middle East.

While India, for the most part, views Trump positively, it’s no surprise that our neighbor to the south rates him differently. The word cloud below illustrates Mexican sentiment.

Figure 6: Mexican International Travelers’ Descriptions of President Trump

Question – What one word best describes Donald Trump?
 

Mexico Trump word cloud

President Trump’s relationship with Mexico is well documented and hardly needs repeating—and the word cloud above very clearly and directly describes the nation’s sentiment. One man, two countries, and their opinions of him are like night and day.

The overall impact of President Trump’s actions is yet to be seen. However, as evidenced by the response to President Trump’s recent travel ban, it is likely to be pronounced and uneven across international markets. Destination Analysts’ eye is firmly on this for the industry, and we will share with you what we learn from travelers as this presidency progresses.

Sharpen your pencils.  It’s time to test your knowledge of international travelers.

Until recently, detailed marketing intelligence on our international markets was hard to come by.  We at Destination Analysts are devoted to changing this.  The eight questions below are taken from this year’s The State of the International Traveler survey.  This survey was conducted among 800 internationally-oriented travelers in each of America’s twelve largest feeder markets (Canada, Mexico, Japan, China, South Korea, Australia, India, United Kingdom, France, Germany and Italy).   In total, over 10,000 of these travelers were queried for this survey about topics related to visiting the United States.

These questions can be a little tricky, so we’ve given you a hint after each. Our best advice is not to over think.  Use your intuition and you should do well.  Good luck!


1

Hint:  One of the most important experiences international visitors report wanting in a U.S. trip is spending time in major cities.


2

Hint:  The recent hype seems like it may not be hype after all.


3

Hint:  Okay.  This one should be easy.  Almost a gimme.


4

Hint:  Which destination do you think is more exotic?


5

Hint:  Despite stereotypes, travelers in all countries think with one item they always carry with them.


6

Hint:  Why do people generally use travel agents?


7

Hint:  This one might surprise you given one country’s well-known love of motorcars.


8

Hint:  As fun as it might be, not everyone is interested in one of these things…


Okay.  Pencils down.  To see the answers to the test, just download this pdf file and look beneath the questions.  If you answered five or more correctly, you’re in rare company!