The State of the American Traveler in April 2023—Potential Travel Spending Reductions, Top Travel Pet Peeves

Current financial sentiment may keep Americans from spending as freely as they did a year ago, however record levels of travel enthusiasm keeps them planning trips. Meanwhile, pet peeves about the travel experience abound, from transit delays to snoring seatmates.
These findings are brought to you from our independent research, which is not sponsored, conducted or influenced by any advertising or marketing agency. The key findings presented below represent data from over 4,000 American travelers collected in March 2023.
American Travelers’ Financial Sentiment and Its Impact on Travel
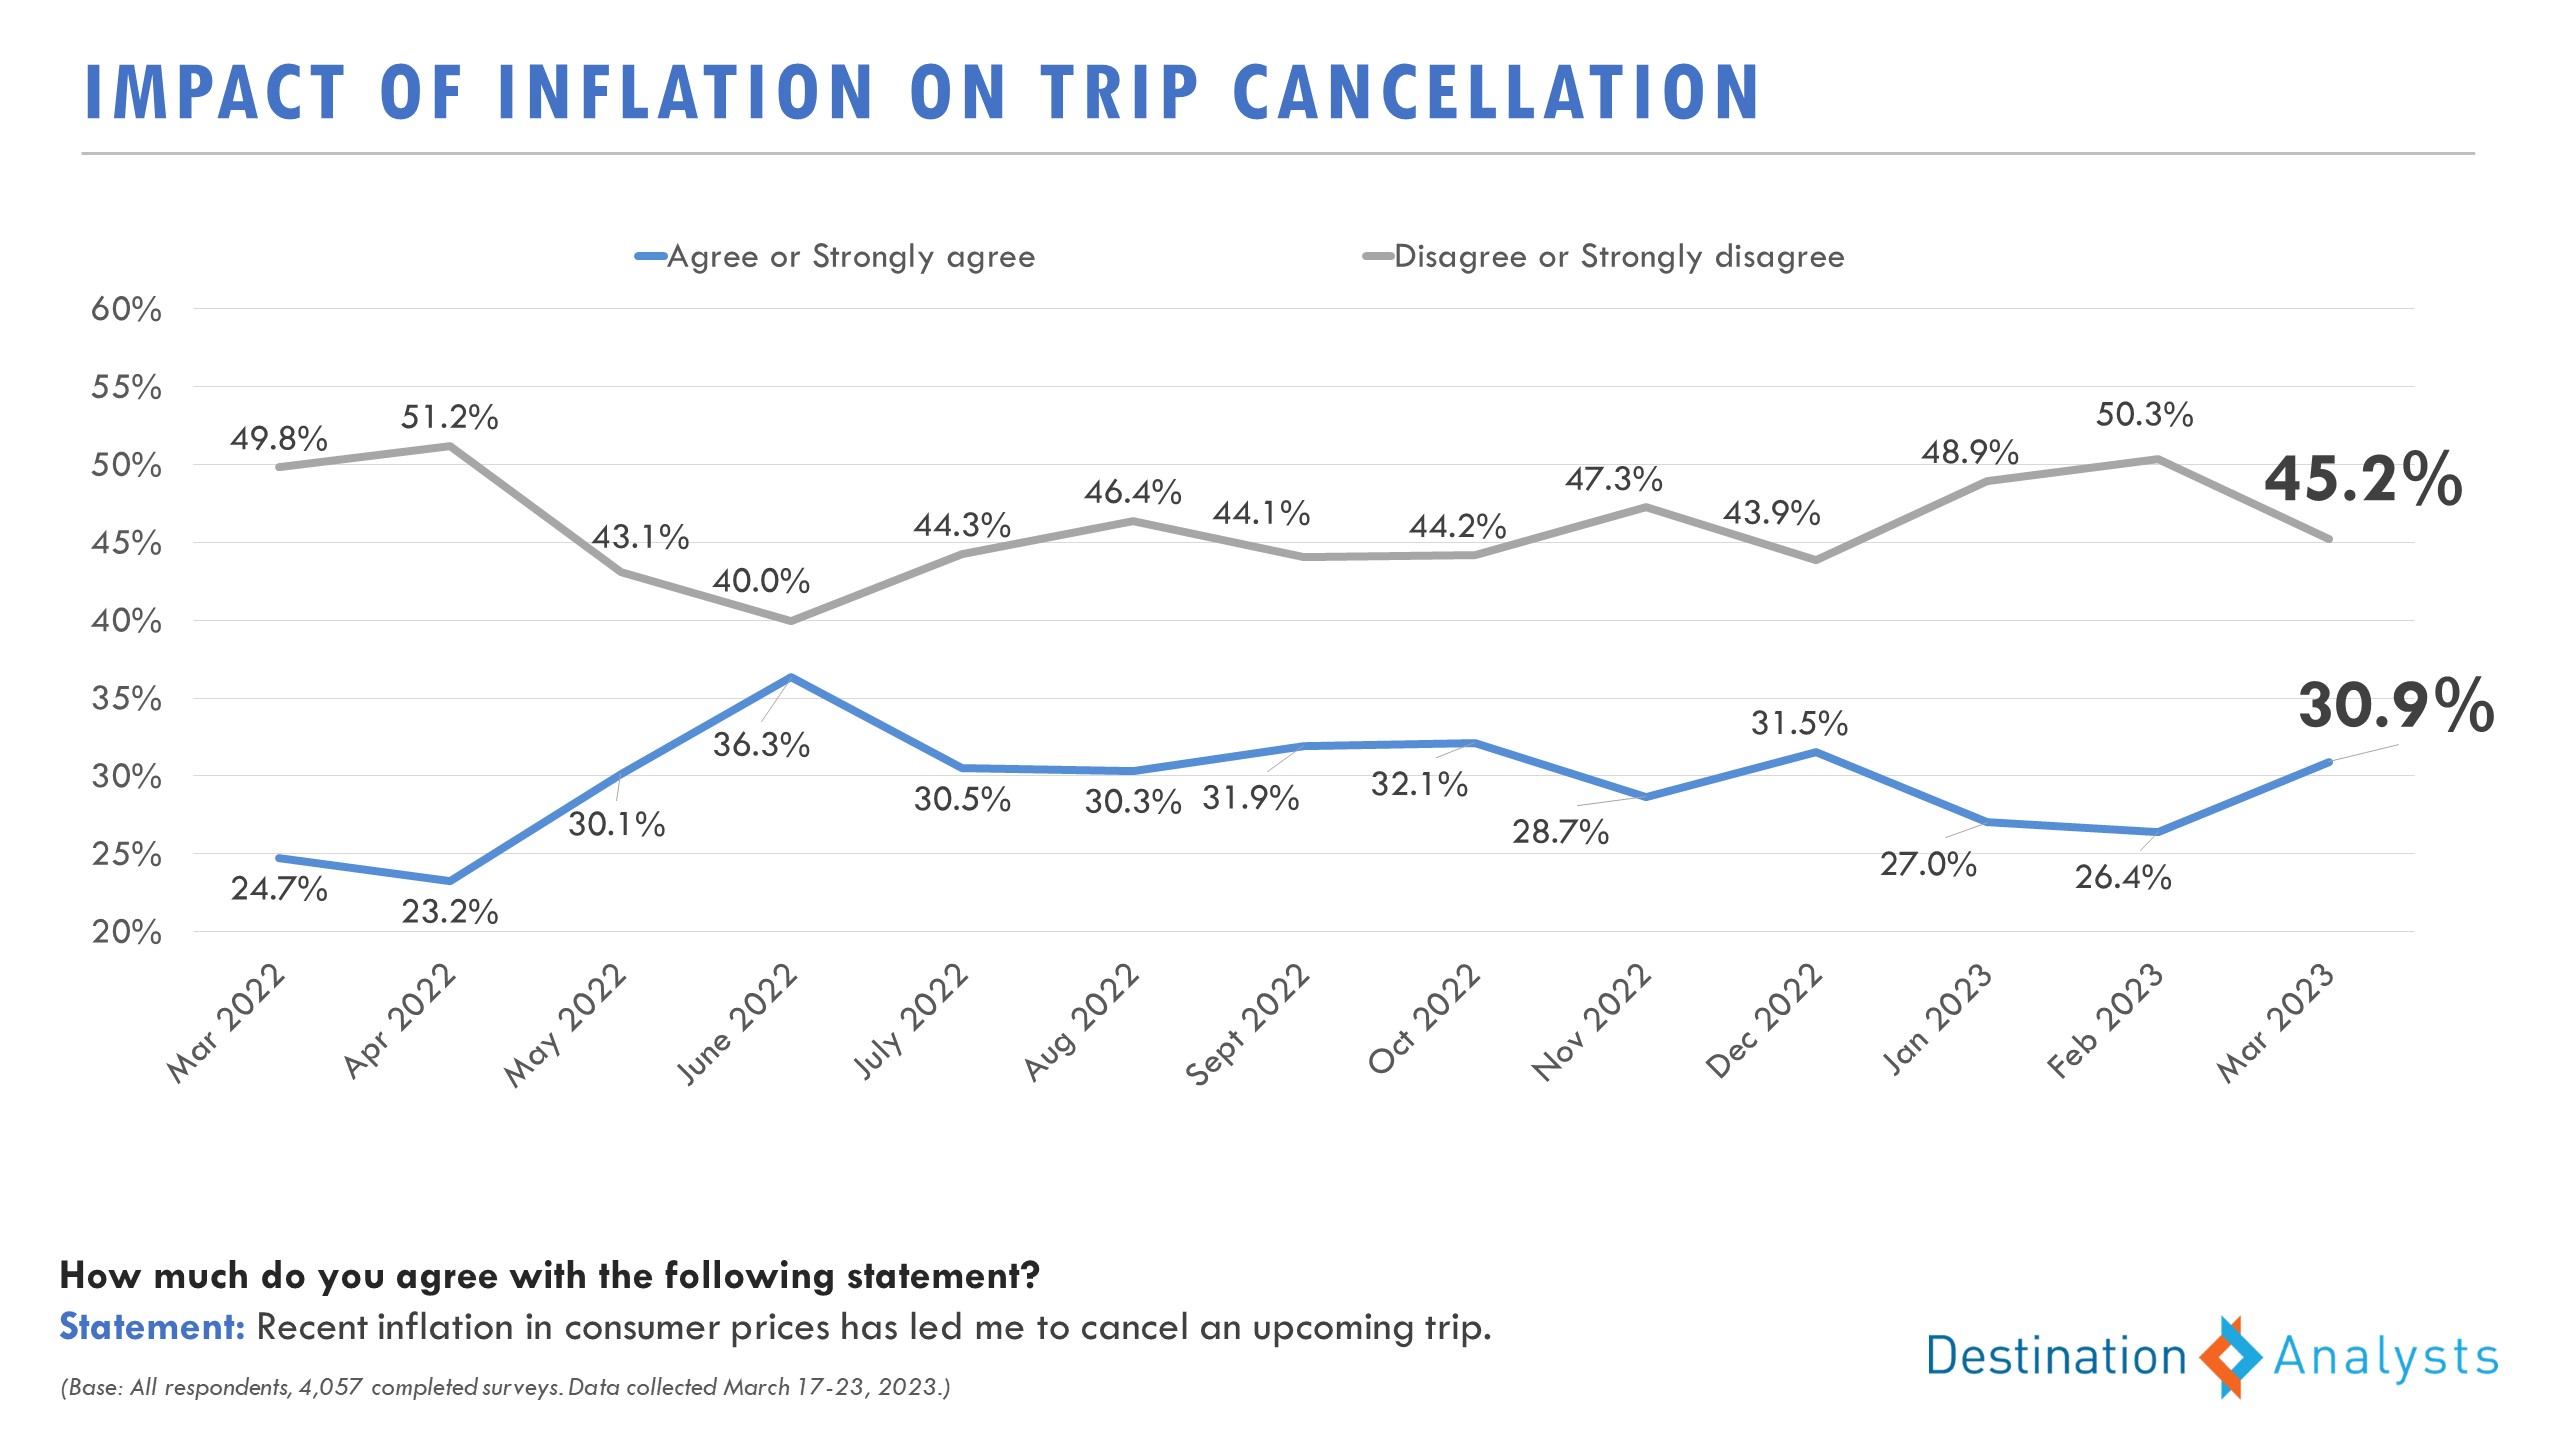
Will Americans curb their travel spending enthusiasm in the coming months? The percent of American travelers who report being better off financially today than they were a year ago is at 32%. While this is up 6-points from the end of 2022, compared to how they felt at the same time last year, it is down 2 points. Optimism about their future financial situation does remain solid at 47% and is up nearly 5 points compared to one year ago. Nevertheless, Americans express some financial fears that spill over into their anticipated travel behaviors. After being around 27% for the first months of the year, the percent of Americans who say recent inflation in consumer prices has led them to cancel an upcoming trip ticked back up to 31%—the level it was throughout Summer and Fall 2022. Right now, 55% believe the U.S. will enter a recession within the next 6-months. As a result, 60% report they are being careful with their money because of their recessionary concerns. Both beliefs have increased over the last month. As to whether the present is a good time to spend on travel, 30% say it is, however this is down nearly 8-points from the same time last year. Those that say travel will be a high priority in their spending over the next 3 months is at 55%—a drop from 61% reported during the same period in 2022. The percentage who says they will take more trips in the next year compared to the previous year dropped to a four-month low 29% and is down from 35% at the same period last year. Similarly, the percentage saying they will spend more on travel in the next 12-months compared to the previous year is at 32%, down from 37% in March 2022. Average reported 12-month travel spending has dropped to $4116 from $4667 although is still above March 2022 at $4080.
Travel Enthusiasm Keeps the Travel Outlook Healthy
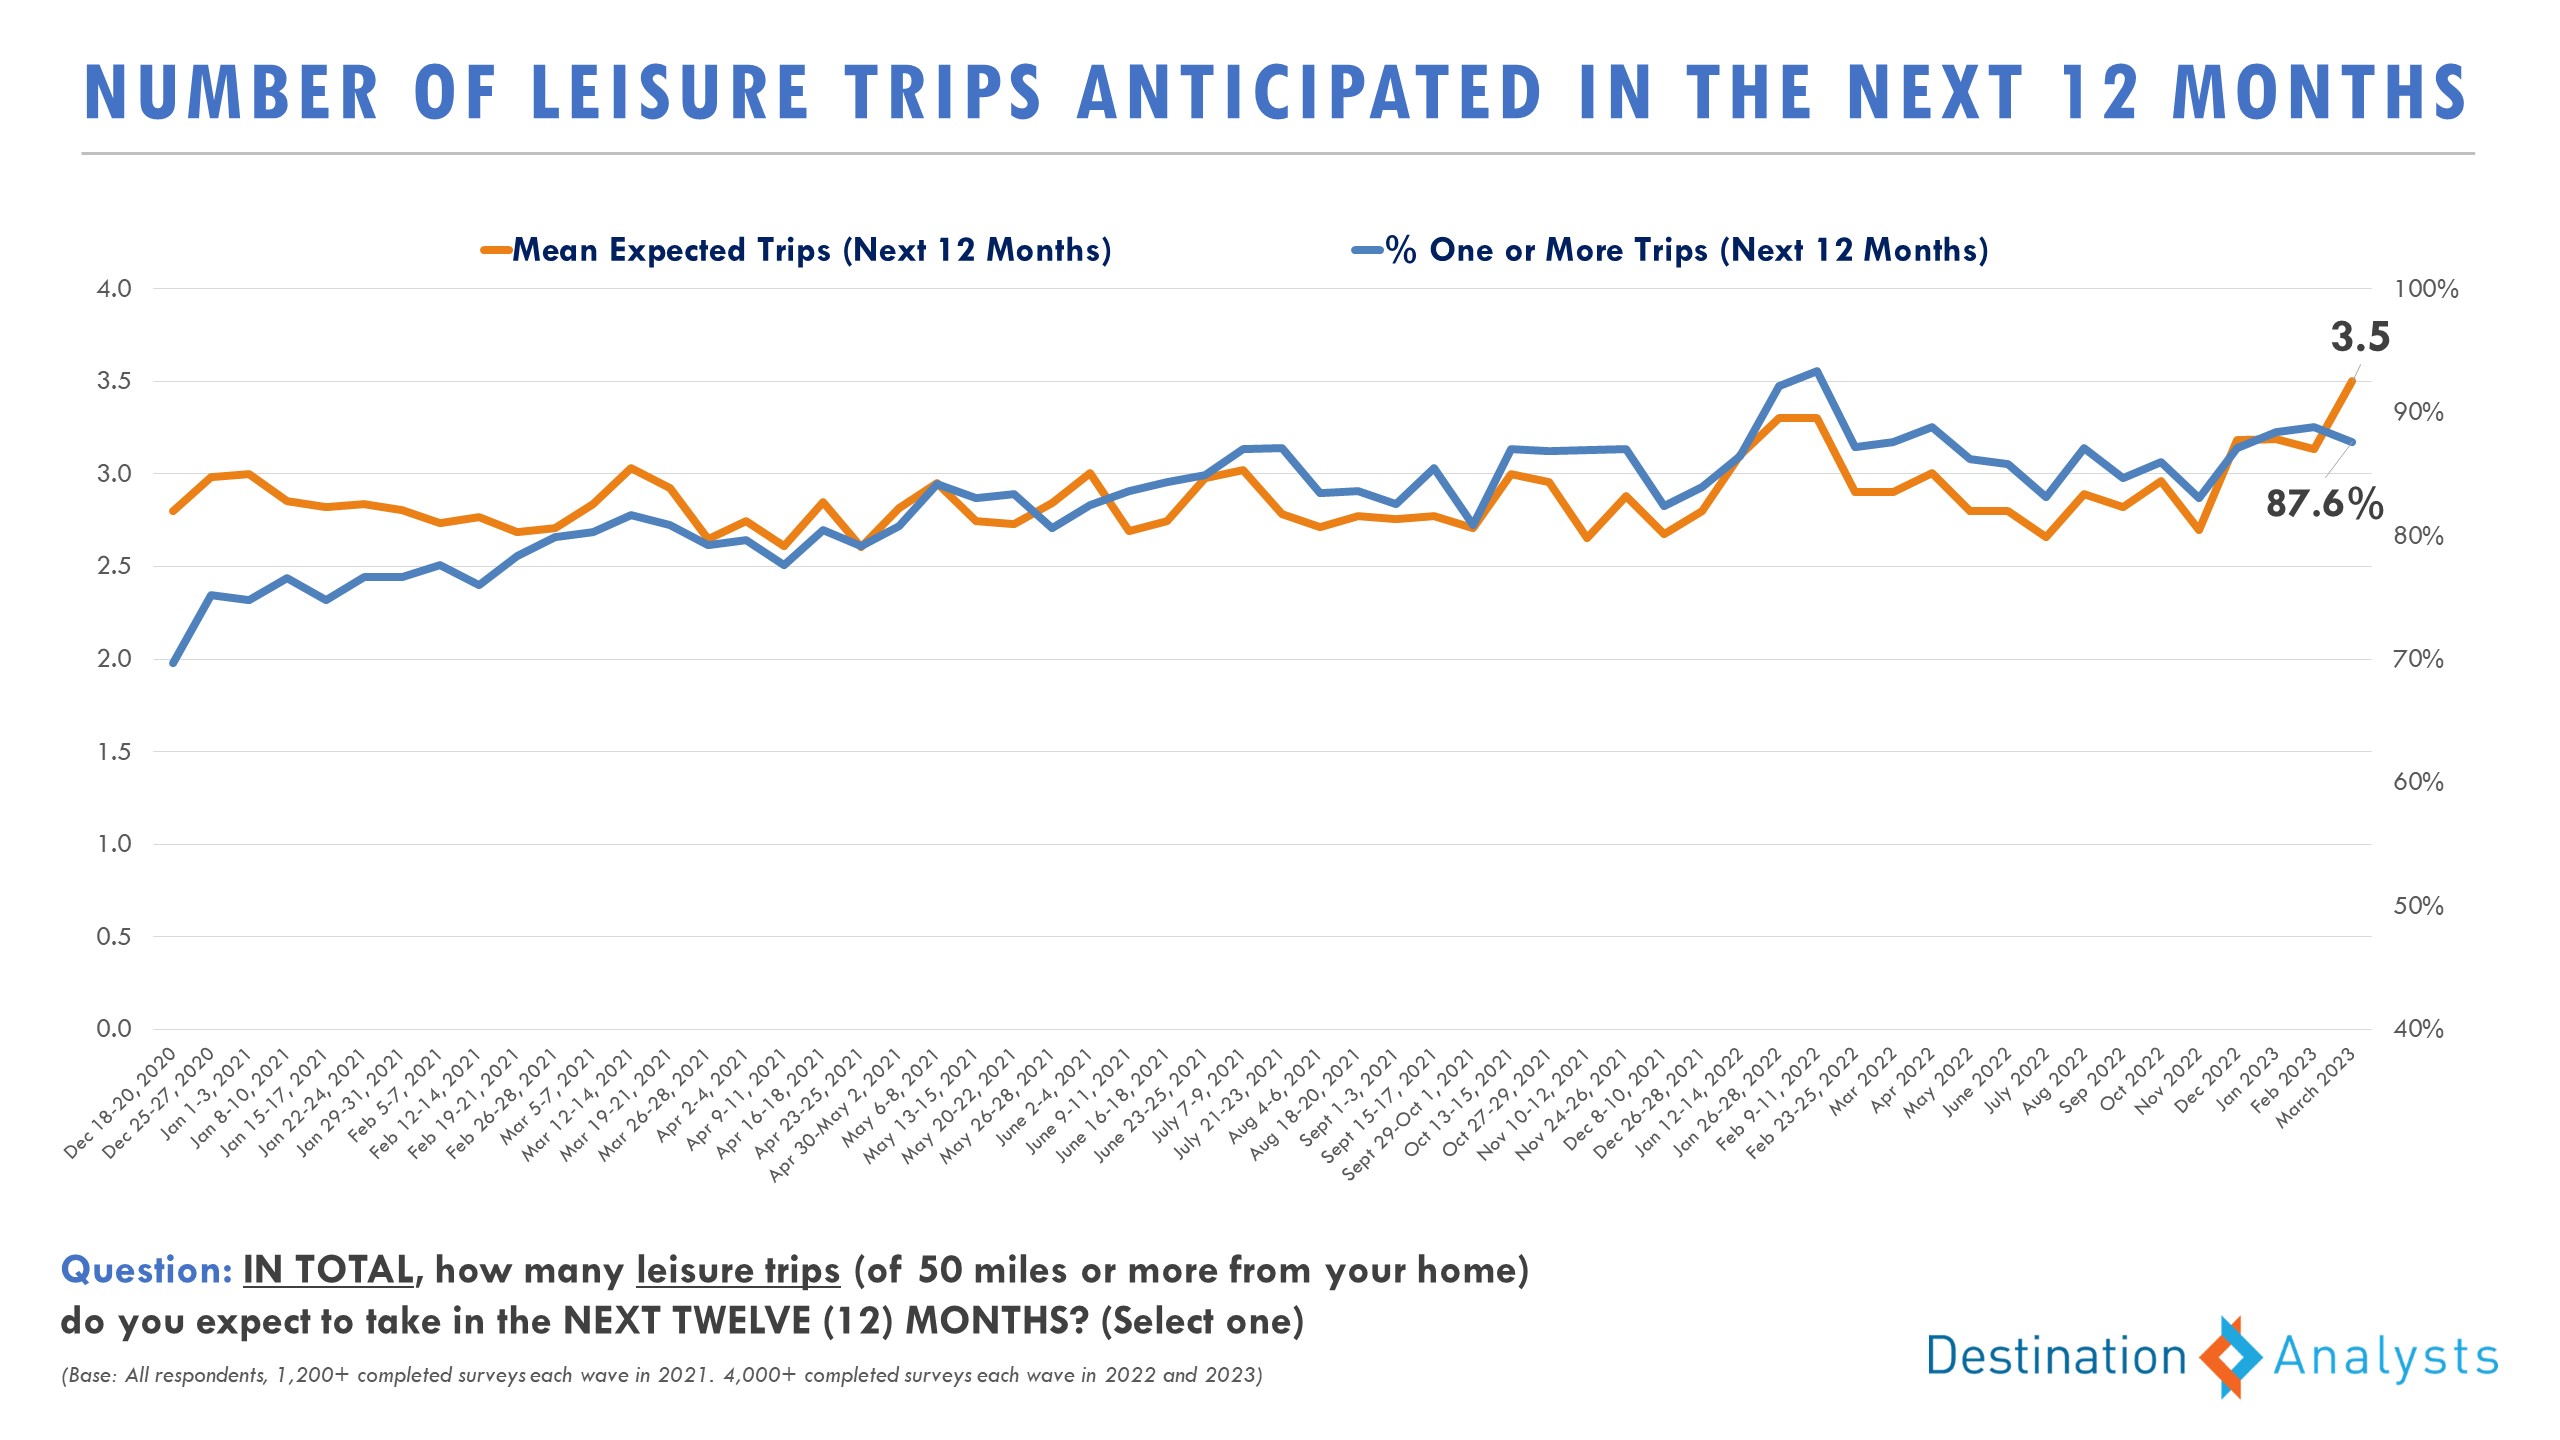
Despite the challenges of the current financial sentiment, Americans’ excitement for travel remains near record levels (8.1 on a 0-10 scale). Nearly 85% of American travelers have trips planned. Despite the decline in their optimism about their trip volume in the coming months, the typical American traveler says they expect to take 3.5 leisure trips in the next 12-months, up from 2.9 reported at the same time a year ago. On average, American travelers say they have more than 15 days devoted to travel this year. Travel deterrents are down overall, notably gas (34%) and airfare (24%) being too expensive and too many crowds (12%). Prioritizing luxury travel experiences has hit a 12-month high 49.2%—nearly 10-points higher than at the same time last year.
Is engagement up on your organization’s marketing channels? It wouldn’t surprise us if so. With the summer season approaching, 80% of American travelers reported doing some travel dreaming or planning in the last week alone. Over 35% of these travelers said they researched travel ideas online, which is up from 31% who reported such at the same time last year. When recent trip-takers were asked how many hours they personally spent actively planning or researching their trip AFTER they arrived in their destination, the average was 2.5 hours. Note that Millennial and Gen Z travelers are above average at 3 hours, while Boomers are well below, spending just 1.4 hours planning once in-market. Across the U.S., Northeasterners say they spent 2.7 hours, while Southerners report a more relaxed 2.3 hours. Of those still doing trip planning post arrival, restaurant reservations top the list (35.2%), but lodging comes in second (26.4%), followed by attractions (20.0%). Interestingly, after hovering around the 11-week mark, this month the average trip planning window for a 1-week domestic vacation dropped to 10 weeks.
Top sources of travel inspiration continue to be websites found through searches, email campaigns, Facebook, Instagram, and other online article/blog content.
Americans’ Top Travel Peeves
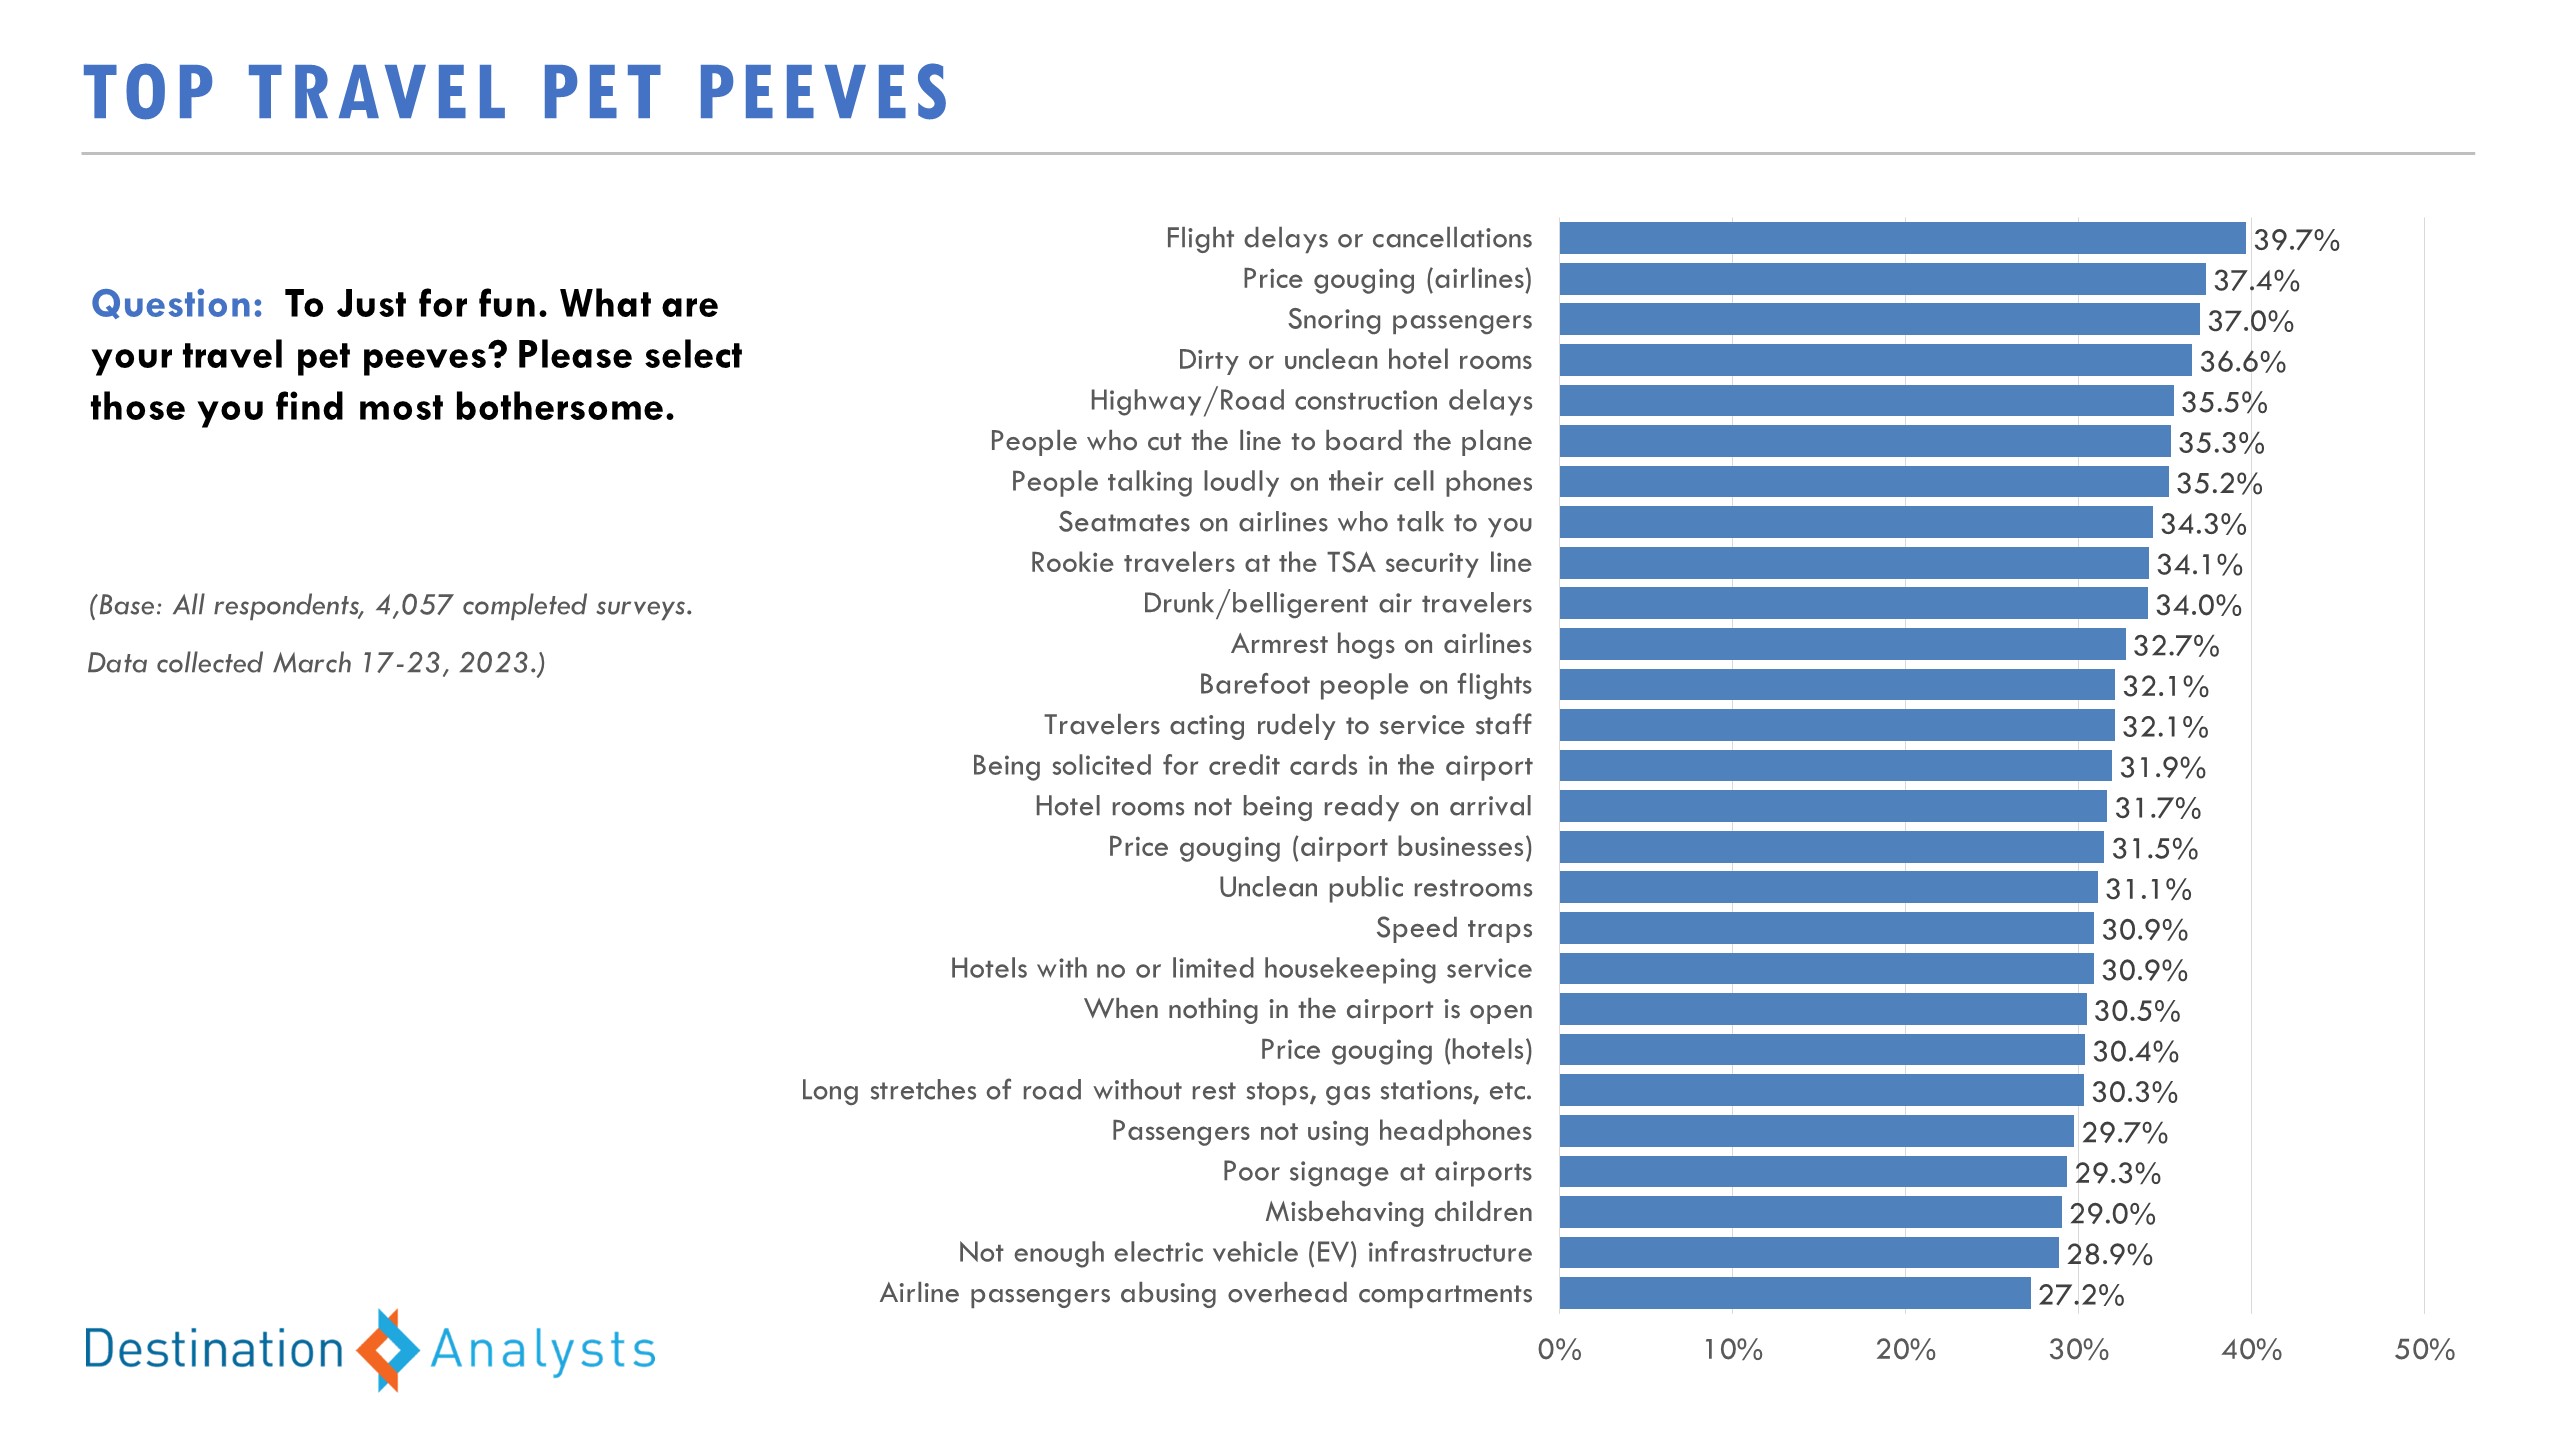
Although we in the travel industry strive for our customers to have happy, rave-worthy experiences, clearly, they still experience annoyances during their journeys. This month we presented our survey respondents with a list of travel pet peeves sourced from complaints we had seen on the Internet (as well as our own team’s) and asked which they found most bothersome. While several of the top slots are industry caused—Flight delays (#1), price gouging (#2), dirty hotel rooms (#4), road construction (#5)—many are social-related or caused by other travelers: Snoring passengers (#3), people cutting lines at boarding (#6), people talking loudly on their cell phones, (#7) seatmates on airlines who talk to you (#8), rookie travelers at the TSA security line (#9), and drunk or belligerent passengers (#10). This certainly makes the case for “How to be a thoughtful fellow traveler” campaigns!
For the complete set of findings, including historic data and custom information on your destination or business, purchase a subscription to The State of the American Traveler study.
Learn more about the latest trends during our webinar.
To make sure you receive notifications of our latest findings, you can sign up here.
Have a travel-related question idea or topic you would like to suggest we study? Let us know!
We can help you with the insights your tourism strategy needs, from audience analysis to brand health to economic impact. Please check out our full set of market research and consulting services here.

