A Travel “Epidemic” Is Here

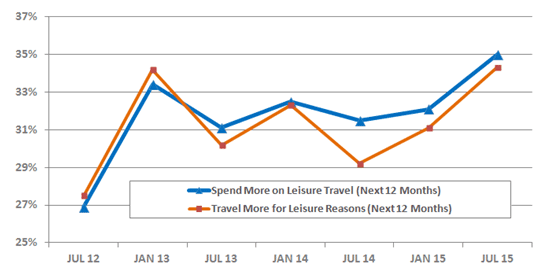
A strong optimism is pervasive amongst American leisure travelers, suggesting continued good times—or likely even better ones—are in store for the travel industry.  In the latest Destination Analysts’ The State of the American Traveler survey, which tracks traveler sentiment, expectations for near-term leisure travel have soared quite beyond what has been seen in the past nine summers, and may have reached an all-time high.  In typical summer waves of this survey, enthusiasm for travel is muted compared to January.  At this point in the year, travelers have been quite possibly satiated from recent summer adventures, or they might also be in the midst of planning for an impending trip.  Whatever the cause, travel expectations have been invariably lower. However, this July, more than a third (34.3%) of American travelers said they expect to increase the number of leisure trips they will take in the upcoming year. This marks an increase from 31.1 percent in January and significantly above levels seen in previous summer waves of the survey, in which only 29 percent of travelers expected to travel more in the upcoming year.

American travelers are in the mood to spend, too, with spending expectations sky high.   Fully 35 percent of travelers say they expect to spend more on their leisure trips in the coming 12 months. This again breaks with the summer norm, where in the last three years an average of just 29.8 percent of travelers expected to increase their trip spending.

The table below illustrates this upward bounce in American’s demand for increased travel volume and spending.

Recent Historical Perspective
American Leisure Travelers Planning to Travel and Spend More (% All Travelers)
SATS-IMAGE
Source: The State of the American Traveler, Destination Analysts, Inc.

These results fit nicely with national sentiment trends which show that consumers feel significantly better about the economy overall this summer.  The Conference Board recently reported that its index of consumer confidence jumped to 101.4 in June from 94.6 in May.   Nothing drives demand like consumers feeling positive about the economy and their personal economic situation.  This coupled with the increased social value being placed on travel, and the outlook for leisure travel demand in the near term is rosy. The remainder of this year should be a great one for the industry.

Download your copy of the summary The State of the American Traveler report here.


Check out our new Destination Analysts adventure video made by Bogdan and the team at IRIS Adventures! As we braved the rugged challenges in Golden Gate Park, we refined our communication skills and enhanced our invidual strengths. It was a memorable day and we’re all looking forward to our next teambuilding adventure.

20150312_GCortez_1135


Thank you Bogdan and the team at IRIS Adventures! We had a blast riding GoCars through Golden Gate Park, going on a treasure hunt, solving puzzles, and most of all learning about ourselves and each other. We can’t wait to go an another team adventure! For a day filled with fun teambuilding and challenging yet fulfilling exercises, we highly recommend IRIS Adventures. See more photos of our teambuilding day here.

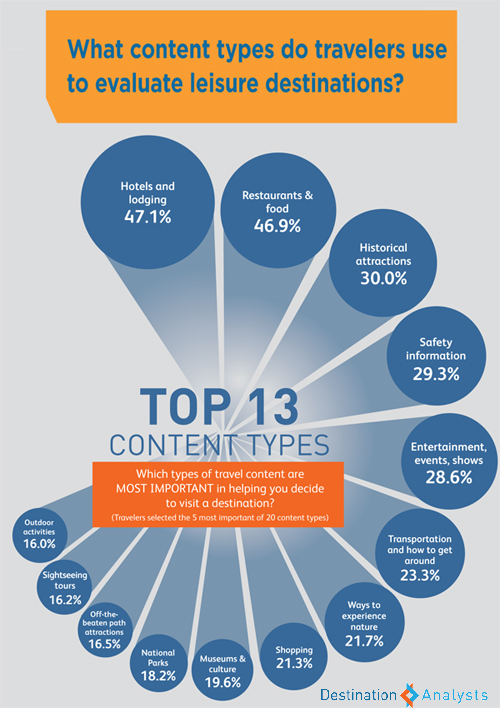
The early 2015 edition of our The State of the American Traveler report is now out. As always, this edition explored several topics relevant to travel marketers and uncovered some fascinating insights about American travelers.  One of the most interesting included the types of content that travelers feel is most relevant to their ultimate destination decision.

Travel resource usage


Long time followers of The State of the American Traveler may recall a similar question asked one year ago. This time, we removed the concept of cost—something most of our destination marketers cannot control–in order to really look at what content motivates the desire to visit. Interestingly, hotel and lodging information still reigns supreme.  However, this is closely followed by restaurant and dining information. People are most interested in where they sleep and what they eat when it comes to picking the destination.

1.  Skift goes old school. The popular travel industry website Skift is launching a print magazine, scheduled for release in January.

2.  Gasoline prices are continuing to fall.  In much of the country, the price of gasoline is now below two dollars–and overall it’s down more than a dollar from last year.

3.  AAA analysis says that lower gas prices will save consumers $75 billion this year. More money in our pockets means more money spent in our destination’s hotels, restaurants, attractions and shops.

4.  American consumer confidence increased in December.  The Conference Board reports that we’re feeling the improved job market and our sense of overall economic conditions haven’t been this high since February 2008.

5.  Aloha record-breaking year.  Hawaii’s tourism industry is reported to be on pace to beat last year’s record performance.

6. Destinations around the country report similar outstanding performances and outlooks.  Here are a few checking in during the past week:  Asheville. Philadelphia. New Orleans.

7.  Hilton Head and San Francisco hit home runs.  Our latest client and our fabulous hometown win a prestigious award.

8. The lodging sector outlook also feels good.  Our friends at PKF have released their Lodging Insights: U.S. Lodging Industry Forecast for 2015.  Take a watch.

9.  It turns out the tourism industry worldwide is big. Really big.  The World Travel and Tourism Council reports that the travel industry’s total contribution to the global economy rose to $6,990 billion, or 9.5% of the GDP.  It is expected to jump up by 4.3% to $7,289 billion, or 9.6% of the GDP for 2014.

10.  Airbnb gets really creative.   Airbnb sets out to help rid the world of strangers and turn us all into interior designers.

On a recent business trip to Alaska, we had lunch with a local entrepreneur whose very first business as a teenager was dog-sitting for tourists while they took day trip sightseeing cruises.  These travelers couldn’t exactly leave their dogs in their hotel or cars for the day, so they were in a pickle.  Neglect their beloved family member or forego one of the pinnacles of the Alaska visitor experience.  Our new friend saw a market for doggy day care and, for a few bucks, took care of his town’s tourist dogs while their families were at sea.

We’re telling you this story to draw attention to a market many DMOs may not be aware of and we’ll give you a word to the wise.  Destinations should not forget visitors traveling with man’s best friend.   While our impulse might be to simply add a “pet-friendly amenities” check box to hotel listings and move on, that would be a mistake.  As DMOs prepare their ever-changing content strategies, considering the needs of this enthusiastic traveling audience could reap significant rewards.

For several years we’ve been tracking the importance of dog-friendly amenities and destinations to the American public.  The results might surprise you. Nearly half of American travelers own a dog and one third of them (33.4%) have taken an overnight leisure trip with Fido in the past twelve months.  When we do the math, it tells us that about 30 million Americans will hit the road this year for an overnight trip with their dogs.

Having dog-friendly accommodations and activities is critically important to them, and they will be looking to you, the DMO, for advice.  Just for fun, here are a few stats from our most recent State of the American TravelerTM study to drive this point home.

Question: How important are pet-friendly policies and amenities to how you generally select your leisure travel accommodations (hotels, motels, etc?)

dog-1

Source: State of the American Traveler, July 2014. Base: American travelers who took an overnight leisure trip with their dog in the past year.  


Question: When you travel with your dog, do you typically choose well-known pet-friendly cities or destinations?
dog-2

Source: State of the American Traveler, July 2014. Base: American travelers who took an overnight leisure trip with their dog in the past year.  

Clearly, this audience will be demanding content that allows them to pick pet-friendly accommodations (is the check box really enough?)  They will also be looking for pet-friendly destinations in which to spend their money.  And dog-centric information is really important to them.  But what’s a DMO to do?  We suggest considering some professional advice.  So, we reached out to our friends at dogtrekker.com and spoke with co-founder Dave Kendrick, about the market and what DMOs should consider.

A few snippets from the conversation follow:

DA:  Tell us a little about DogTrekker.  What’s it all about?

DK:  Well, we launched DogTrekker.com in 2011.  It’s a collaboration of dog lovers who wanted to share what they’ve learned during their equivalent of 200 years of on-the-road and on-the-trail adventures. Based upon their 4-Paw Promise to research local and accurate dog-friendly lodging, chow, hikes, splash zones, attractions and local services; provide engaging content written by veteran travel writers; and demonstrate a strong commitment to local animal welfare groups.

DA:  How big has DogTrekker.com become?

DK:  DogTrekker.com has become the go-to resource for hundreds of thousands of California dog owners.  Prior to DogTrekker.com, there was no way for dog owners to know just how ‘dog-friendly’ a lodging property was. For a hotel or motel, dog-friendly is way beyond putting the check in the ‘pet-friendly’ box and a picture of a dog on their site. Hotels with large numbers of breed restrictions, limited size limits, high dog fees, misleading information on their site and untrained desk personnel fall more into the ‘dog-tolerant’ to ‘dog-unfriendly’ categories and are not listed on the site.

DA:  How important is this to travelers?

DK:  Well, your own research that shows nearly 48% of dog travelers find a poor selection of truly pet-friendly hotels, 80% say hotel polices and dog-friendly amenities are important when choosing a property and nearly 50% are turned off due to high pet fees.  Survey after survey shows that the majority of dog owners feel that their four-legged buddies are an important part of the family and as such, want them to be treated equally or even better than they are when traveling. We see it every trip we take with Kayla, the joy she feels when the lodging property or attraction staff goes out of their way to provide a warm and heartfelt welcome. At DogTrekker.com we measure it in ‘wags per mile.’

DA:  Do hotels get it?  Are they becoming more dog-friendly?

DK:  I mentioned the problems, but on the other side of the leash, you have Kimpton, Loews and Joie de Vivre, Best Western Plus, La Quinta and many more hotel groups who go out of their way to welcome dogs.  With clear, concise policies, superior training of the staff, providing fun and safe dog amenities and a desire to treat the four-legged guests with the same level of respect and courtesy as their 2-legged uprights, these hotel groups are considered by DogTrekker.com to be ‘dog-passionate.’

DA:  Why should DMOs be interested in DogTrekker?

DK:  We have many DMOs working with us now.  In fact, many of California’s destination marketing organizations are Paw-of-Approval partners of DogTrekker.com, collaborating on ways to make their destinations as welcoming and dog-passionate as they can be.

DA:  Thanks, Dave.

As you think about the dog-traveling market, we suggest you give DogTrekker a look.  They have a wealth of fun content and expertise that could be of value to your destination’s content development plans.  Dog Trekker is one of our favorite industry partners, and we strongly encourage our friends in the industry to reach out to them.

Website:  www.dogtrekker.com
Facebook: www.facebook.com/dogtrekker
Twitter:  www.twitter.com/dogtrekker

I really love my job.  One of the most rewarding parts of my work is helping clients show their communities and stakeholders that they’ve made good use of their funding by providing a positive return on investment.   As many of you know, our philosophy at Destination Analysts is to always provide our clients with the most conservative, bullet-proof, state-of-the-art methodologies to measure their marketing programs’ return on investment (ROI).  This approach comes from the many years we spent developing such research techniques for the San Francisco CVB.  Years of presenting ROI estimates to skeptical boards of directors and politicians taught us some very important lessons.  As a result, we carefully build our economic impact models, and whenever assumptions are made, we take the most conservative path possible.

We recently had the chance to apply this way of thinking and conduct some very interesting advertising effectiveness research for our award-winning friends at the Charlottesville Albemarle Convention & Visitors Bureau (CACVB).   If you’re not familiar with this organization’s work, I’d strongly suggest looking at their ideas and practices.  They’re simply an outstanding team of talented marketers, and they’ve hit a home run with their recent advertising campaign.

If you’re interested in learning more about research measuring Charlottesville’s success, check out the press release they sent out yesterday.  It’s well written and is a good model for how a DMO can showcase their results in an effective, easy-to-understand way.

cacvb

Charlottesville Albemarle Convention & Visitors Bureau Advertising in DC Marketplace Yields Positive Economic Impact to Local Area

CHARLOTTESVILLE, VA–(Marketwired – December 10, 2014) – The Charlottesville Albemarle Convention and Visitors Bureau (CACVB) has announced the results of an advertising effectiveness study that shows its advertising and marketing in the Washington, DC metro area has produced significant economic impact to the Charlottesville-Albemarle area.

Destination Analysts, working with the CACVB and through its website management company, Simpleview, completed the “2013-2014 Advertising Effectiveness & ROI Study” to gauge the success of the organization’s recent marketing campaign. The study indicates that more than 23,600 incremental trips to the Charlottesville area were taken by Washington, DC metro area residents as a result of being exposed to one or more ads. These trips resulted in nearly $25 million being spent by visitors in our destination.

Continue reading here.


Travel Outlook for Q1 2015: Low Gas Prices, Fatter Wallets and a Counter-balancing Airfare Effect

As travel moves into the depths of the off-season, our industry is poised for a stronger than normal performance.  Conditions are ripe for increased travel volume and spending this winter.  Driven by an improving labor market and sharply lower gasoline prices and the very significant bump this will provide to consumers’ pocketbooks, travelers will be hitting the roads.  Airfares, however, are not moving in this positive direction, which will counter balance to a limited degree the positive gas price-fueled momentum.

MONEY

Destination marketers should be thrilled.  Fatter wallets and lower gas prices are here (at least for now), which is excellent news for all of us working to lure leisure travelers and their dollars to our communities, attractions, parks and states.

Why?  When Americans travel for leisure, they mostly do it by car.  Our biannual The State of the American TravelerTM Survey consistently shows that nearly 80 percent of leisure travel is done by car.  When gas prices rise we typically see expectations for future travel drop.  Conversely, when gas prices are low, expectations for future travel tend to rise.  It’s a solid, immutable relationship.

The chart below shows recent changes in weekly U.S. retail gasoline prices (all grades in dollars per gallon).  The positive direction is clear and the implications for travel are obvious.  The average price we pay at the pump is down by nearly one dollar since June. The cost of gas dropped to a nationwide average of $2.82 a gallon from as high as $3.71 in June.  This is a national average and in certain markets prices are even lower.

Average Weekly U.S. Retail Gasoline Prices

(All grades in dollars per gallon)

blogpostgraph

Source: U.S. Energy Information Administration

As we move deeper into the off season, not only will travel by car be cheaper, travelers will feel wealthier.  Economists talk of something called the Wealth Effect, referring to the tendency on the part of consumers to spend more when they feel wealthier or more financially secure.   We’re likely to see this come into play in the next few months.  Analysts suggest that the average American household will save nearly $1,100 a year if petroleum stays at these levels.   A $1,100 average bump in disposable income is very significant and most of it will be spent on things like travel.

The good news about gasoline prices presents itself to an enthusiastic traveling public already feeling fewer and fewer constraints on their ability to travel.  Our research shows that in recent years, fewer travelers are seeing gasoline prices and their personal financial situations causing them to cut back on their leisure travels.  The table below (from last summer’s State of the American Traveler report) shows that even when gas prices peaked last summer the proportion of travelers who felt gasoline was keeping them from traveling was in steep decline.  In July 2011, more than half (53.6%) of Americans said gas prices were keeping them off the roads, this metric reached a new 32.4 percent last July.  We’ll be excited to see where this stands when we field the survey again in three weeks.  It will likely be much lower given the gas price trends we have discussed.

reasons blogpost

Further, a growing share of travelers report that concerns about their personal financial situations are also consistently improving.  The table above shows that far fewer Americans now feel their financial situation is keeping them from traveling than just a couple of years ago.  Add stronger labor market conditions and the aforementioned $1,100 gasoline price income bump to their pocketbooks, and conditions for improved travel industry results seem rock solid.

Improving Employment Situation

As we move into the off season, we also see significant recent improvements in labor market conditions, which is key to consumer (traveler) confidence.  The American economy added a massive 321,000 jobs last month, as the nationwide unemployment rate remained at 5.8 percent.  This marks the most robust burst in job gains in several years, and comes alongside upward revisions of 44,000 more jobs added in September and October than previously estimated.  Overall, it looks like 2014 will be the strongest year for hiring since 1999, with average monthly additions to the labor force of over 240,000 jobs.

Airfares Buck the Trend and Airline Profits Soar

A slight downside to our bright outlook for the offseason is in air travel.   Anyone who has recently traveled by air has seen the shift toward full planes and crowded boarding areas.  Sadly, long gone are the days of comfort where we spread out and took the middle seat and didn’t share an arm rest.  Unfortunately, long gone too are the days where travelers benefited from commodity price fluctuations like decreasing jet fuel prices.

Competition is Good.  Consolidation is Bad.

This counter intuitive situation in the marketplace for air travel is powered by the slew of airline mergers in recent years, allowing these companies significant power in manipulating their capacity and prices.  More market power by the airlines doesn’t work in the best interests of travelers–and fares paid by the two million daily American air travelers tell a striking story.   Airfares have not fallen of late despite the downward fall in jet fuel prices that have accompanied those seen in gasoline.

Over the past 12 months, jet fuel prices domestically have dropped about 11%, according to the International Air Transport Association.  However, airfares have not responded to decreasing fuel costs, actually going up 0.2% this year.  Looking at the somewhat longer term, average U.S. domestic airfares bottomed out over five years ago, and have been rising since. Airfare has steadily increased in recent years, growing 10.7 percent in the past five years, according to an Associated Press analysis.

Travelers, however much they’ve lost through reduced competition in the air industry, are nothing if they aren’t resilient.  Despite changes resulting in steadily increasing ticket prices, our research shows that the degree to which airfares are getting in the way of travel is stable and even slightly improving.  Since January 2010, the proportion of American leisure travelers cutting back on travel due to high airfare has fallen slightly from 32 percent (in July 2011) to 24 percent last summer.  It appears that travelers may have adjusted to the marketplace and worked expectations for higher airfares into our budgeting and travel decision making.

Fortunately, too, for the destination marketing industry, fewer than 20 percent of ALL leisure trips are taken by air.   The outlook for leisure travel as we move into the new year is very positive.  I’m excited to field our next The State of the American Traveler survey in a few weeks to test these waters and see if travelers are feeling the optimism that I expect.

Readers can check back soon for the next The State of the American Traveler study or sign up here for the report that I’ll release in a mid January.

When I read last week that that international visitors to the United States spent $19.2 billion on their trips to the United States in August alone, it made me want to put this number in perspective. After all, we live in a world where multi-billion dollar price tags are seemingly norm. Huge dollar figures are commonplace. In news stories like this, a few billion here or a trillion there seems so pedestrian that these numbers have almost lost their true meaning.

It’s understood that $19 billion is a lot of cash, but exactly how much? Just for fun, I’ve put together a brief list of things that could be bought for the same amount international visitors to the US spent in August 2014.


DestinationAnalystsStudentTravel

A whole lot of education: The College Board reports that a “moderate” college budget for an in-state public college averages $22,826 annually. At this rate, $19 billion could pay for about 840,000 of our kids to attend college this year. How many students is that? Approximately the total student population at the eighteen largest universities in America. If divided equally, that’s 16,800 students in each of the fifty states.


DestinationAnalystsScience

Guns or lab coats: According to available statistics, the $19 billion international visitors spent in August could fund the entire budget of the National Science Foundation for 2.5 years. Or it could buy twenty-four B-2 stealth bombers.


DestinationAnalystsFootball

Thirteen NFL Franchises: With a reported average value of $1.43 billion, you could buy 13 NFL teams and still have money left over. Basically, you would have a controlling interest in one of the nation’s most beloved industries. As a light side note, the average NFL cheerleader is reported to make about $650 annually for their efforts (Note: I have a special place in my heart for the fair pay cause of NFL cheerleaders, as one of the whistle blowers once worked for us doing visitor surveys…and she was one of the hardest working we’ve ever had). So for one month of international tourism, we could hire nearly 30 million cheerleaders, or interestingly, 46,000 mascots (who apparently make about $44,000 annually).

The list could go on and on, but I’m sure you get the point without me having to. International tourism is critically important to the economic vitality of our country. But while there’s no lack of clarity in what international visitor spending represents, could someone help me with understanding why the market value of a someone dancing around in a costume is forty times that of a professional cheerleader?

Sources: This post is just for fun, but some of the sources I’ve used for the calculations above are: The US Bureau of the Census, Forbes Magazine, Bloomberg.com and Celebritynetworth.com


Sharpen your pencils.  It’s time to test your knowledge of international travelers.

Until recently, detailed marketing intelligence on our international markets was hard to come by.  We at Destination Analysts are devoted to changing this.  The eight questions below are taken from this year’s The State of the International Traveler survey.  This survey was conducted among 800 internationally-oriented travelers in each of America’s twelve largest feeder markets (Canada, Mexico, Japan, China, South Korea, Australia, India, United Kingdom, France, Germany and Italy).   In total, over 10,000 of these travelers were queried for this survey about topics related to visiting the United States.

These questions can be a little tricky, so we’ve given you a hint after each. Our best advice is not to over think.  Use your intuition and you should do well.  Good luck!


1

Hint:  One of the most important experiences international visitors report wanting in a U.S. trip is spending time in major cities.


2

Hint:  The recent hype seems like it may not be hype after all.


3

Hint:  Okay.  This one should be easy.  Almost a gimme.


4

Hint:  Which destination do you think is more exotic?


5

Hint:  Despite stereotypes, travelers in all countries think with one item they always carry with them.


6

Hint:  Why do people generally use travel agents?


7

Hint:  This one might surprise you given one country’s well-known love of motorcars.


8

Hint:  As fun as it might be, not everyone is interested in one of these things…


Okay.  Pencils down.  To see the answers to the test, just download this pdf file and look beneath the questions.  If you answered five or more correctly, you’re in rare company!