When I read last week that that international visitors to the United States spent $19.2 billion on their trips to the United States in August alone, it made me want to put this number in perspective. After all, we live in a world where multi-billion dollar price tags are seemingly norm. Huge dollar figures are commonplace. In news stories like this, a few billion here or a trillion there seems so pedestrian that these numbers have almost lost their true meaning.

It’s understood that $19 billion is a lot of cash, but exactly how much? Just for fun, I’ve put together a brief list of things that could be bought for the same amount international visitors to the US spent in August 2014.


DestinationAnalystsStudentTravel

A whole lot of education: The College Board reports that a “moderate” college budget for an in-state public college averages $22,826 annually. At this rate, $19 billion could pay for about 840,000 of our kids to attend college this year. How many students is that? Approximately the total student population at the eighteen largest universities in America. If divided equally, that’s 16,800 students in each of the fifty states.


DestinationAnalystsScience

Guns or lab coats: According to available statistics, the $19 billion international visitors spent in August could fund the entire budget of the National Science Foundation for 2.5 years. Or it could buy twenty-four B-2 stealth bombers.


DestinationAnalystsFootball

Thirteen NFL Franchises: With a reported average value of $1.43 billion, you could buy 13 NFL teams and still have money left over. Basically, you would have a controlling interest in one of the nation’s most beloved industries. As a light side note, the average NFL cheerleader is reported to make about $650 annually for their efforts (Note: I have a special place in my heart for the fair pay cause of NFL cheerleaders, as one of the whistle blowers once worked for us doing visitor surveys…and she was one of the hardest working we’ve ever had). So for one month of international tourism, we could hire nearly 30 million cheerleaders, or interestingly, 46,000 mascots (who apparently make about $44,000 annually).

The list could go on and on, but I’m sure you get the point without me having to. International tourism is critically important to the economic vitality of our country. But while there’s no lack of clarity in what international visitor spending represents, could someone help me with understanding why the market value of a someone dancing around in a costume is forty times that of a professional cheerleader?

Sources: This post is just for fun, but some of the sources I’ve used for the calculations above are: The US Bureau of the Census, Forbes Magazine, Bloomberg.com and Celebritynetworth.com


Sharpen your pencils.  It’s time to test your knowledge of international travelers.

Until recently, detailed marketing intelligence on our international markets was hard to come by.  We at Destination Analysts are devoted to changing this.  The eight questions below are taken from this year’s The State of the International Traveler survey.  This survey was conducted among 800 internationally-oriented travelers in each of America’s twelve largest feeder markets (Canada, Mexico, Japan, China, South Korea, Australia, India, United Kingdom, France, Germany and Italy).   In total, over 10,000 of these travelers were queried for this survey about topics related to visiting the United States.

These questions can be a little tricky, so we’ve given you a hint after each. Our best advice is not to over think.  Use your intuition and you should do well.  Good luck!


1

Hint:  One of the most important experiences international visitors report wanting in a U.S. trip is spending time in major cities.


2

Hint:  The recent hype seems like it may not be hype after all.


3

Hint:  Okay.  This one should be easy.  Almost a gimme.


4

Hint:  Which destination do you think is more exotic?


5

Hint:  Despite stereotypes, travelers in all countries think with one item they always carry with them.


6

Hint:  Why do people generally use travel agents?


7

Hint:  This one might surprise you given one country’s well-known love of motorcars.


8

Hint:  As fun as it might be, not everyone is interested in one of these things…


Okay.  Pencils down.  To see the answers to the test, just download this pdf file and look beneath the questions.  If you answered five or more correctly, you’re in rare company!

We are excited to share a video we have composed from interviews with our wonderful clients who discuss their experience working with Destination Analysts. We debuted this at the 2014 Marketing Outlook Forum in Atlanta where our team had an amazing time sharing, learning and interacting with other industry insiders. This video truly speaks to the caliber of work we provide and shows the importance we place on the happiness and satisfaction of Destination Analysts’ clients!


The Generation of Yes and America’s Greatest Idea

America’s National Parks are indeed our country’s greatest idea, but they face a serious challenge in attracting a new generation of digitally-oriented visitors.  Attracting a more youthful audience is both a challenge and a great opportunity for the National Park Service.  When it comes to travel, the millennial generation (those born between roughly between 1980 and the mid 2000s) is called the “Generation of Yes” by our team due to their extraordinary interest in visiting all types of travel destinations and unbridled enthusiasm for living of life full of diverse travel experiences.  However they may pay lip-service to the importance of adding natural experiences to their travel resume. Many Millennials are still uncomfortable with the disconnection from their networks they associate with outdoor experiences.  They also hold a strong general preference for big city travel experiences over rural ones in nature. 

Our founder, David Bratton, spoke yesterday to a group of National Parks decision makers and stakeholders at an event held at the U.S. Department of Interior in Washington, DC.  Bratton encouraged the audience to aggressively market its assets in order to elevate awareness among younger Americans. He discussed the importance of positioning the park experience in line with the travel experiences most desired by the young generation (bucket list fulfillment, bragging rights, high energy excitement and self-improvement).

A livestream recording of the event can be seen here.


Nature is Important. Being Disconnected is Scary.

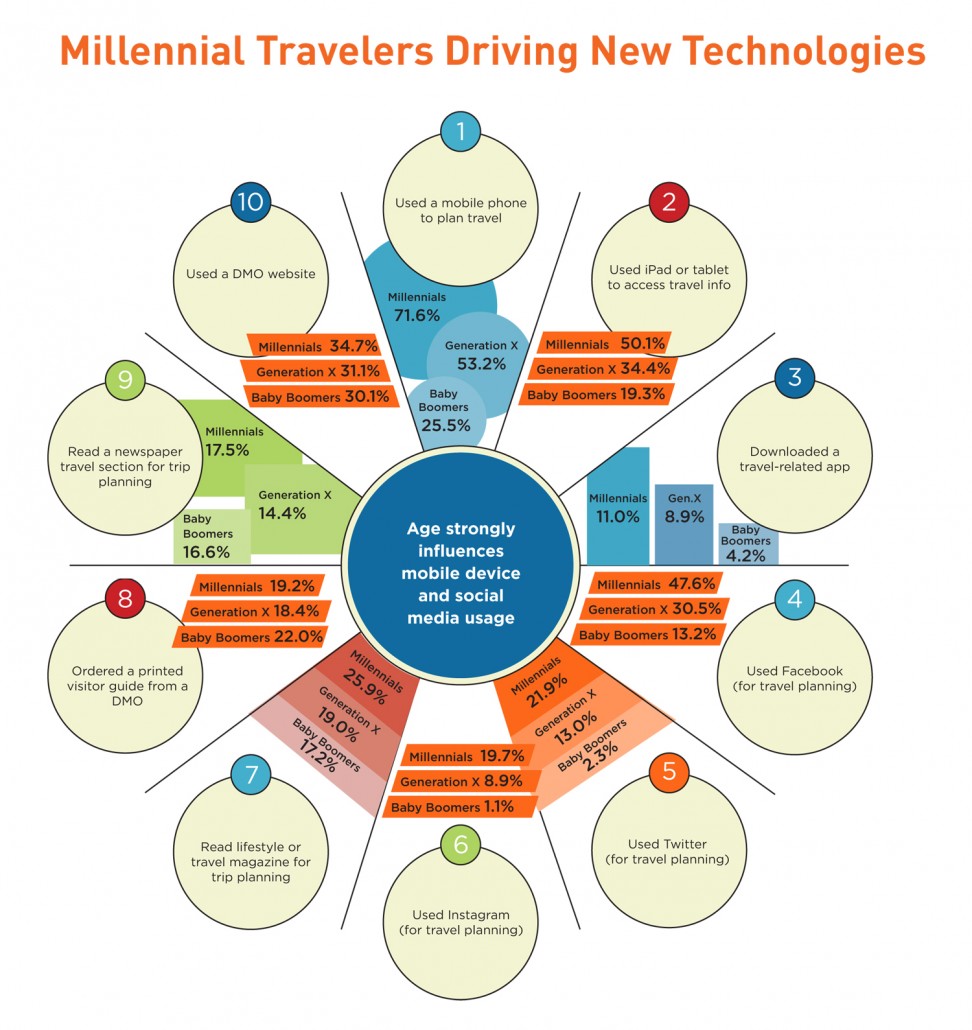
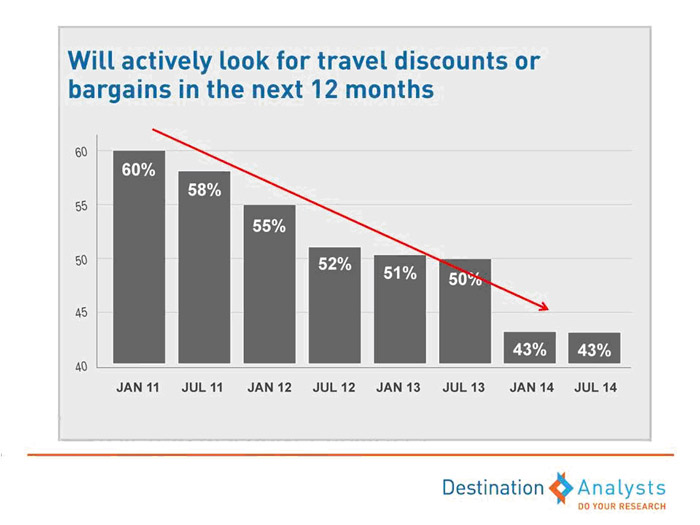
Millennial travelers show interest in the extraordinary array of travel experiences offered by the National Parks.  Data collected in Destination Analysts biannual The State of the American Traveler Study paint a picture of a generation that fully appreciates the great outdoors.  When asked if quiet, peaceful destinations are typically the “best vacation spots,” the vast majority (80%) express agreement.   Similarly, more than 60 percent of Millennials agree that experiencing nature away from urban areas is an important part of their leisure travels.  Despite this positive overall sense, the generation shows marked discomfort with being disconnected, even on vacations.  Bratton shared a quote from a recent in-depth interview he conducted that captures the feeling of many in the generation.  Referring to Millennials, one participant said, “We may say we love the great outdoors, but being disconnected is a little scary.”

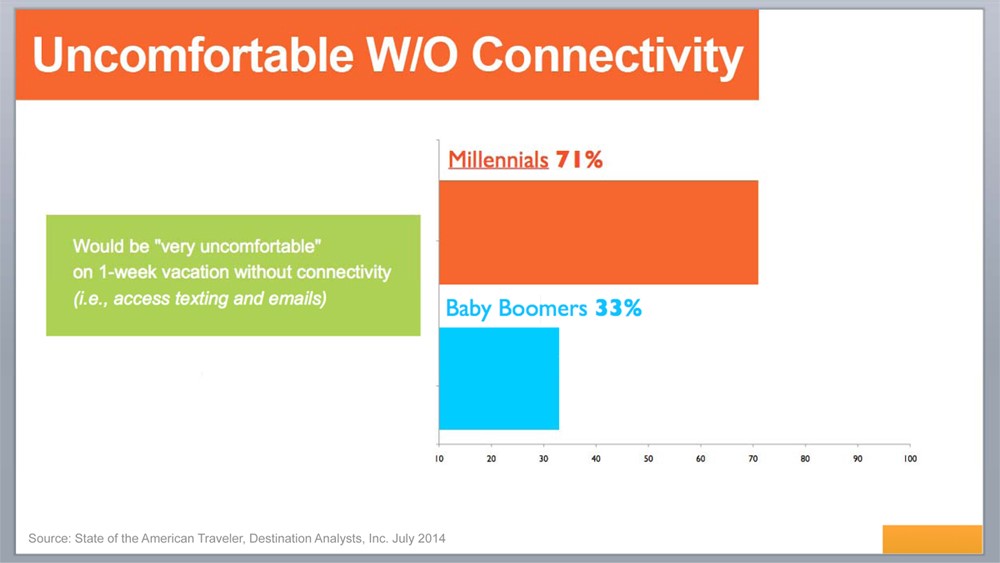
The State of the American Traveler sheds further light on this phenomenon.  When asked if they were deprived of the ability to text and check email for one week while on vacation, fully 71 percent of Millennials say they would feel “Very uncomfortable.”  By comparison, only one third of Baby Boomers felt similarly.

Uncomf


The Challenge:  Attracting Millennials in a Competitive World

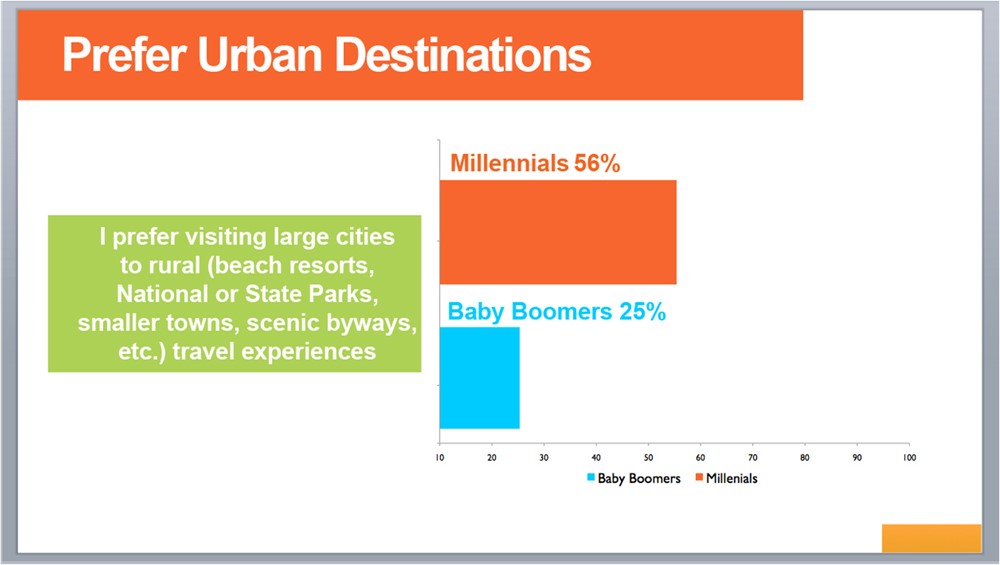
Where the rubber really hits the road for the National Parks is with its competition.  Bratton showed that the generation’s travel expectations are extremely high and the competitive set faced by destinations like parks is not only domestic, but worldwide.  These younger Americans already travel more than their older counterparts, they show much high propensities to travel by plane (less by car) and are about twice as likely to take an international leisure trip.  This is not good news for parks that historically have relied on the traditional road trip for many of its visitor arrivals.  Additionally, the Millennial generation shows a general preference for the excitement of urban destinations over rural destinations.  When asked in The State of the American Traveler Study if they generally prefer big city travel experiences to rural ones like National Parks, the majority agreed that they tend toward urban the experiences.   The chart below illustrates this finding and highlights the competition faced by our parks.

Prefer Urban


Keys for Marketing to Millennials

In this environment of extreme competition, how can the Park Service reach young travelers?  Bratton suggested the following three general guidelines:

Stress Value:  The Millennial generation has not yet reached the peak of its earnings potential.  It also has not fully reached the life stage where its members enjoy the buying power benefits of dual income status.  Highlighting the value proposition of visiting the National Parks is clearly a winning strategy.

Embrace Their Need for Connectivity:  Bratton argued that Millennials’ strong desire to be connected to their networks is not only healthy, it is integral to their identities.   Purists who think that connectivity and the National Parks experience are somehow incompatible should rethink.  It is simply not something that can be ignored by those marketing travel to National Parks.  The community should emphasize experiences that generate bragging rights and allow these young travelers to envision exciting, active experiences with their friends and relatives. Bratton said, “While a baby boomer may dream of going off alone into the Sequoias like John Muir to commune with God, this imagery just isn’t going to appeal to younger travelers.”

Go Digital:  These digital natives require a highly-tailored digital approach that is both somewhat avant-garde and easy to consume.  Bratton said, “Young people of any generation can smell cool,” and encouraged the audience to think about positioning the parks experience in a way the generation finds hip, comfortable and exciting.  Making online content easy to access and consumer-friendly is also critical for a generation “well known for its lack of patience for poorly designed digital interfaces.”

Bratton’s full PowerPoint presentation can be downloaded here.

Visit our friends at the National Parks Hospitality Association to learn more about efforts to market our National Parks.

If you have any doubt that the Millennial Generation is the driving force behind the adoption of new technologies in travel industry, take a look at our latest State of the American Traveler infographic. It’s interesting to note, too, that Millennials use more traditional information sources at similar rates as their older counterparts.

Millennial-Infographics


Source: State of the American Traveler, July 2014. Destination Analysts, Inc.

During the recent 2014 eTourism Summit held in San Francisco, CA, Destination Analysts listened to a special presentation by Andrew Smith, Chief Funster and winner of the Best Job in the World for Visit Australia. As Chief Funster, Andrew traveled across Australia to promote Sydney & New South Wales, documenting his experiences through social media to prove that New South Wales is the most fun destination in the world. Andrew was selected from over 124,000 applicants to fill the position. How did he win the Best Job in the World? He created an entry video that told a riveting and engaging story. Having conducted dozens of website usability studies for DMOs across the country, I quickly realized that elements of Andrew’s video also apply to successful DMO websites. I affirm that implementing the following guidelines will lead to a great DMO website:

1) Tell a story. Andrew narrates his video informing viewers that he’s visited ten countries in the past two months. He doesn’t just say this, but also shows it with action-packed footage of him in various countries. From the beginning of the video, it’s clear who Andrew is: he’s driven, ambitious, adventurous and cultured.

Based on my experience interviewing numerous travelers as they use DMO websites, the most successful sites are the ones that tell the story of who they are. For example, take FortWorth.com. From the homepage and throughout the website, Fort Worth presents itself as the “City of Cowboys and Culture.” While there is text on the site that describes Fort Worth as a destination where you can experience the American West, as well as cultural treasures, it’s the visually appealing images across the site that convey the message. Images of Longhorns and cowboys, museums, and Downtown tell website visitors exactly who Fort Worth is.

FtWorth


2) Cater to your audience. Critical qualifications for applying to be Chief Funster are having fun and the desire to travel. Andrew specifically compiled images of him having fun while traveling, showing the selection committee that he understands exactly what they’re looking for and why he should be hired.

Like Andrew who catered to the selection committee, successful DMO websites cater to its audience, whether it is non-locals who are intrigued by unique attractions, scenic beauty, shopping, music festivals, etc., or all of the above. This is something that constantly comes up in our website usability studies, and I certainly know is a key factor in keeping website users on a site.  ZionNationalPark.com does a great job of this. Website visitors to this site likely aren’t interested in an urban vacation consisting of fine dining, arts & culture or shopping. Those who come to the site want to be in nature, hike, and soak up Zion’s spectacular scenery – exactly what is depicted in the images on ZionNationalPark.com. Furthermore, the website includes the option to view it in one of several languages, demonstrating that ZionNationalPark.com is serving its international audience.

Zion National Park website usability


3) Differentiate. As previously mentioned, Andrew states and shows that he has traveled to ten countries in only two months. This is a very unique fact about Andrew, one that other applicants likely could not claim nor portray in their submission video, thus differentiating him from everyone else.

Likewise, DMO websites that truly captivate site visitors are ones that exhibit what is unique about the destination. I observe this in our website usability studies all the time. Website visitors want to know what they can do in the destination that they can’t do anywhere else. Upon arriving at the homepage of WyomingTourism.org, website visitors are immediately informed that they can experience Old Faithful Geyser in Yellowstone National Park, see Devil’s Tower National Monument, and visit Grand Teton National Park, all of which are offerings unique to the state of Wyoming.

Wy


Like Andrew Smith, a DMO website too, should tell a story, cater to its audience, and differentiate itself to attract and keep the attention of its website visitors.

Bratton Speaks at Pennsylvania Tourism Forum

Americans are showing strong levels of optimism for leisure travel in the upcoming year. Yet, we have not fully recovered from the effects of the 2008 financial crisis and recession. Levels of expected (as well as actual) leisure travel are reserved compared to the period immediately before the crisis. On a positive note, however, it is clear that we’ve moved out of our strong post-recession desire for discounts and special offers, with traveler interest in these sharply diminishing in recent years.

In his recent keynote address to the Pennsylvania Association on Travel and Tourism (PATT) in Lancaster, Destination Analysts Founder and Managing Director David Bratton briefed the industry on the current state of leisure traveler sentiment. In his speech, Bratton presented results from Destination Analysts’ bi-annual The State of The American Traveler Survey. This comprehensive survey is the nation’s first and longest running tracking study of American leisure travel sentiment conducted exclusively for the destination marketing industry. Collected every six months from a representative sample of 2,000 domestic leisure travelers, the survey illustrates trends and opinions of our nation’s leisure traveling set.

Positive Outlook, but no Full Recovery Yet

Destination Analysts’ research shows that (in terms of expectations for travel in the upcoming year) Americans are indeed gung-ho for more travel, with the vast majority either planning to hold constant the number of trips they will take (60.2%) or increase their travels (29.2%). Only 10.6 percent expect to cut back relative to the most recent twelve month period. According to Bratton, “it’s clear that the vast majority of Americans are feeling good about their likelihood of traveling this year.”

Bratton pointed out that while this was great news for the industry, to the surprise of many in the audience, “we have not yet fully recovered our mojo from those heady pre-recession days.” The chart below shows the detail. When we compared the average for the two years immediately prior to the financial crisis of 2008, we see a significant drop in the proportion of Americans who are expecting to travel more. In the two years immediately prior to the recession, 36.2 percent of leisure travelers said they would travel more. This compares to only 31.5 percent for the most recent two years.

Bratton explained that a similar story can be seen in the percent of travelers expecting to cut back on their travels. As the chart below shows, prior to the recessionary period fewer than one in ten (9.6%) of American leisure travelers said they would cut back on travel. In the most recent two years, this result is slightly higher at an average of 11.3 percent.

Clearly we have a way to go.

This story of strong (yet from an historical perspective diminished) travel expectations is supported by the actual number of leisure trips (50 miles or more one way) that Americans report having taken in the past year. As the chart below illustrates, the annual number of leisure trips taken by the typical American is down, from 5.4 trips in the immediate pre-recession period to 4.7 trips in the most recent five survey periods.

Spending Expectations Tell the Story

Bratton noted that “the real key to understanding current traveler confidence may be seen in looking at their spending expectations.” Nowhere is the picture clearer than when we compare the proportion of travelers who expect to increase their travel budget in the next year. The chart below shows that in the two years prior to the recessionary crash, 42.4 percent of traveler said they expected to increase their leisure travel spending in the upcoming year. In the most recent two years, this average stands at only 32.1 percent, nearly a 25 percent decrease.

While spending expectations are weak, Bratton pointed to numerous positive signals in leisure traveler confidence. These included greatly reduced proportions of travelers saying their personal financial situations, gasoline costs or airfare prices have kept them from traveling more than they would like to have traveled in the past year. Most encouraging, however, may be the marked decrease in consumer interest in travel discounts and bargains. Immediately after the financial collapse nearly 70 percent of travelers said they would be “actively seeking” travel discounts and bargains in the upcoming year. As the chart below shows, there has been a sea-change in this attitude. In the past year, just over 40 percent of American leisure travelers will be discount and bargain hunting.

“American leisure travelers are ready to go,” says Bratton, “but make no mistake, we’re not fully back. Not yet. While one could chose to be discouraged by these findings, a more constructive way of looking at the situation is that we have room to grow. As the economy continues to recover we expect to see more and more Americans traveling and generating even more support for our state and local economies.”

Click here for the complete PowerPoint presentation.