As with anything, treating big data as a magic bullet can lead to wounds
This piece was inspired by a recent feature on NPR’s Science Friday that I consider a must-listen to for anyone who relies on or otherwise uses big data in their business processes: http://bit.ly/1Ymx6ap (the title is a perfect summation: “Why Machines Discriminant and How to Fix Them”). As more big data services compete for voice in decision-making and the band-wagon types rally around the newest with the easiest supplied “answers,” perspective is desperately in order. As anyone that actually has substantial experience working with data knows, data is messy. As such (and pointedly illustrated in the Science Friday piece), it is critical to apply the same analytical and intellectual rigor to our interpretation of big data that we do with survey and all other data. If we don’t, we risk making major decisions on data that may not be entirely appropriate to the questions being asked.

—————————-
Exhibit A: Credit Card Conundrum
Tourism research is awash in exciting, new big data solutions, many of them fantastic and many to-be-seen. All share a promise to answer pressing destination marketing organization (DMO) questions. DMOs frequently reach out to us for advice on these products: Is the value worth the financial commitment? How can my DMO use the information, given my staffing resources? How reliable and overall meaningful is data aggregated from one set of sources about my visitors? What truthful insights can truly be drawn?
Big data can be extraordinarily valuable. In fact, in its proper place it is invaluable. Where would we be without Google Analytics to help understand our website users’ behaviors? How relevant would our community building efforts be without Facebook’s audience insights? Online retailers have irrefutably proven that their big data sets can be harnessed to improve practically every aspect of their online targeting and sales. The march toward integrating big data into our decision making is powered by countless success stories.
It is important to note, however, that these success stories are very typically internal solutions, using corporate customer data to solve the problems of that same corporation. What they aren’t is a re-purposing of internal data to solve problems external to the company. The most successful solutions are not simply an attempt to monetize an internal data set to solve problems unrelated to the corporation collecting the data.
To understand, we need to step back into the world of survey research for a moment. While the rules of survey methods and statistics might seem arcane and unapproachable to some, they need not be. The essence of a good survey is surprisingly simple. What makes or breaks a survey depends on two things. How good is your questionnaire? And, how well does the sample collected represents the population you’re trying to study? Everything depends on these two things, and a good researcher will go to any length to ensure his/her sample is “representative.”
In short, survey data needs to look like the population studied. We call this a representative sample; one that accurately reflects the members of the group you seek to understand. Basically a sample should be an unbiased indication of what the overall population looks like. For example, if half of your visitors are day-trippers and half are hotel guests, a representative sample might include 200 day visitors and 200 hotel guests. When a sample is not representative, we get results with what researchers call sampling error, which is bad. Sometimes it’s really bad and leads to bad decision-making. Going back to the visitor example, if we have a sample of 100 day trippers and 300 hotel guests, whatever conclusions we might draw from this sample will not translate to the entire population of visitors studied.
We urgently need to apply this same line of thinking to the monetized big data sets we use.
We need to be asking and thinking about whether a big data set (no matter how massive) really reflects the larger population of visitors examined. The thoughtful analyst will carefully consider whether he/she can make generalizations about the destination’s visitor populations from the big data set of just one company, even if the company has a large market share. As example:
- Can we use data from one credit card company to make generalizations about the entire population of visitors to a destination?
- Are subscribers to one mobile carrier significantly different from other carriers? If so, does using the data set from a single mobile carrier’s subscribers create an unbalanced look at visitors and their behaviors/activities in-market?
- How about online travel agencies (OTAs)? Are people who use these services the same as travelers who book directly? If not, can we really make generalizations about our visitor population based solely on data from people who book through OTAs?
The answers to these questions are, of course, shrouded in mystery, as proprietary data sets are often impenetrable and/or not comparable to other big data sets. We can, however, look to other sources for clues as to whether or not a specific big data stream might be representative of the typical population of travelers.
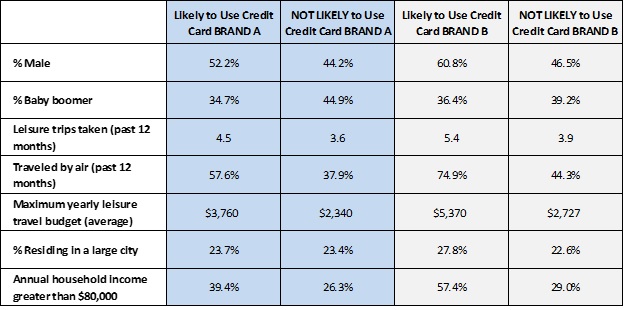
With this in mind, we recently added several questions to our (now quarterly) The State of the American TravelerTM survey to look for answers for our industry peers. This study collects travel opinion from a nationally-representative sample of 2,000 American leisure travelers every three months. Let’s take a look at American leisure travelers who say they will be likely to use one of two major credit card brands while traveling for leisure in the next 12 months. For each card, we compare the travelers likely to use it while traveling to those who are not likely to use that card for trip purchases. The results show an immediate and striking picture. Leisure travelers who say they are likely to use either of these cards while traveling differ in significant ways from their non-card using traveling counterparts.
The table below shows a several pertinent examples. We are not naming the card brands, but they are ones we all know.

SOURCE: The State of the American TravelerTM, Destination Analysts, Inc.
The picture is clear. We see that travelers likely to use either major brand are very different from other travelers:
- Compared to other leisure travelers, those who are likely to use credit card “BRAND A” are less likely to be baby boomers, take more leisure trips annually than other travelers and are more likely to travel by air for leisure. Further, they are more affluent and have significantly higher annual travel budgets. That is, they are bigger travel spenders.
- Likely credit card “BRAND B” users differ even more strikingly from non-users. Those who say they are likely to use “BRAND B” are far more likely to be male and also take far more leisure trips (especially by air). They are more affluent and their annual travel budgets are far, far larger than those travelers who do not use this card.
Application: Where the Rubber Meets the Road
In fairness, these groups do have some similarities. Their opinions on many travel-related subjects line up neatly. In the DMO world, however, where the rubber tends to meet the road is in visitor spending and, based on this data, we have reason to suspect that these groups of travelers may spend quite differently. That needs to keep that in mind when using data about these credit card holders and applying it to a generalization about a destination’s visitor population.
This is but a cautionary tale. DMOs should think very carefully about how they plan to use big data sets before accepting them as appropriate for their needs. A simple first consideration is how truly representative of visitors the data is. If this thoughtfulness is not applied, it risks poor decision-making and inaccurate reporting, and the consequent deleterious effect that can have on communities. None of us want that.


